
|
Avaliação DCF da Fingermotion, Inc. (FNGR) |
Totalmente Editável: Adapte-Se Às Suas Necessidades No Excel Ou Planilhas
Design Profissional: Modelos Confiáveis E Padrão Da Indústria
Pré-Construídos Para Uso Rápido E Eficiente
Compatível com MAC/PC, totalmente desbloqueado
Não É Necessária Experiência; Fácil De Seguir
FingerMotion, Inc. (FNGR) Bundle
Como investidor ou analista, a calculadora DCF da Fingermotion, Inc. (FNGR) serve como seu recurso preferido para uma avaliação precisa. Carregado com dados reais da Fingermotion, Inc., você pode ajustar facilmente as previsões e observar os efeitos em tempo real.
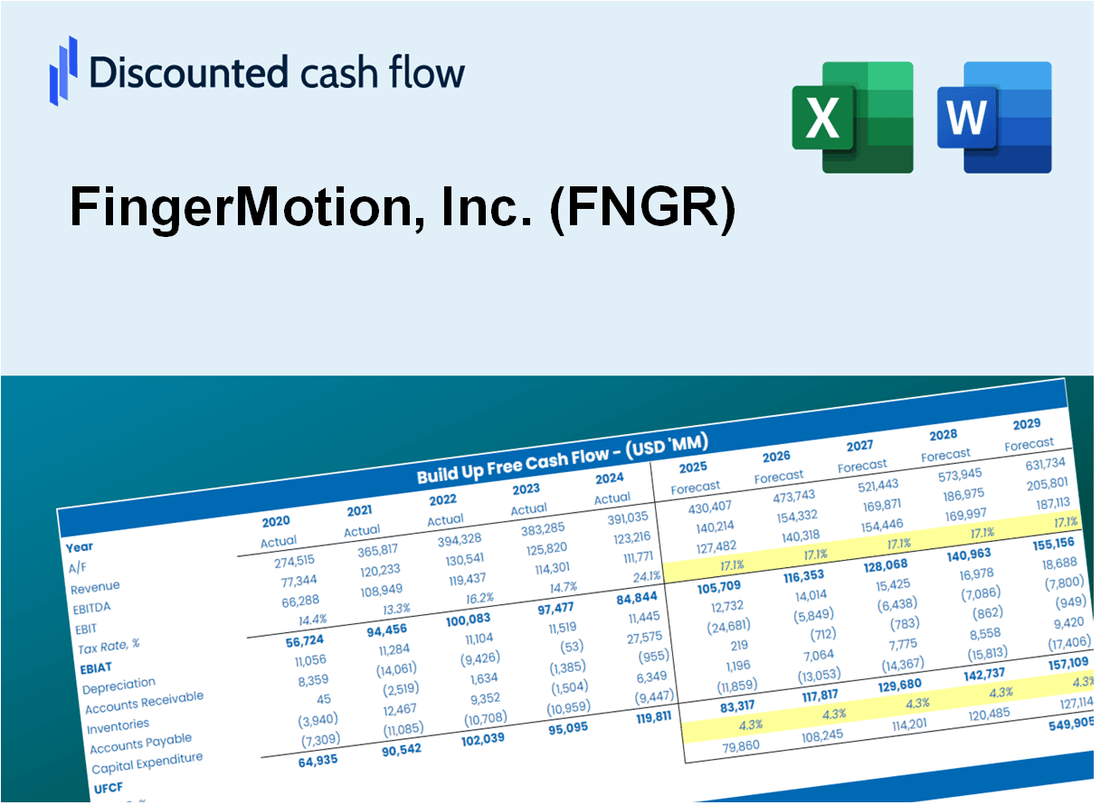
Discounted Cash Flow (DCF) - (USD MM)
| Year | AY1 2021 |
AY2 2022 |
AY3 2023 |
AY4 2024 |
AY5 2025 |
FY1 2026 |
FY2 2027 |
FY3 2028 |
FY4 2029 |
FY5 2030 |
|---|---|---|---|---|---|---|---|---|---|---|
| Revenue | 16.7 | 22.9 | 34.1 | 35.8 | 35.6 | 43.7 | 53.6 | 65.7 | 80.5 | 98.8 |
| Revenue Growth, % | 0 | 37.43 | 48.53 | 5.1 | -0.51428 | 22.64 | 22.64 | 22.64 | 22.64 | 22.64 |
| EBITDA | -4.1 | -4.7 | -6.8 | -3.6 | -5.7 | -7.9 | -9.7 | -11.9 | -14.7 | -18.0 |
| EBITDA, % | -24.44 | -20.55 | -19.94 | -10.11 | -15.92 | -18.19 | -18.19 | -18.19 | -18.19 | -18.19 |
| Depreciation | .0 | .1 | .1 | .1 | .2 | .1 | .1 | .2 | .2 | .2 |
| Depreciation, % | 0.16217 | 0.25251 | 0.1853 | 0.19812 | 0.4395 | 0.24752 | 0.24752 | 0.24752 | 0.24752 | 0.24752 |
| EBIT | -4.1 | -4.8 | -6.9 | -3.7 | -5.8 | -8.1 | -9.9 | -12.1 | -14.9 | -18.2 |
| EBIT, % | -24.6 | -20.81 | -20.13 | -10.31 | -16.36 | -18.44 | -18.44 | -18.44 | -18.44 | -18.44 |
| Total Cash | .9 | .5 | 9.2 | 1.5 | 1.1 | 3.6 | 4.5 | 5.5 | 6.7 | 8.2 |
| Total Cash, percent | .0 | .0 | .0 | .0 | .0 | .0 | .0 | .0 | .0 | .0 |
| Account Receivables | 5.6 | 4.9 | 1.3 | 11.1 | 32.7 | 15.9 | 19.4 | 23.8 | 29.2 | 35.9 |
| Account Receivables, % | 33.6 | 21.26 | 3.92 | 31.02 | 91.76 | 36.31 | 36.31 | 36.31 | 36.31 | 36.31 |
| Inventories | .0 | .0 | .0 | .0 | .1 | .0 | .0 | .1 | .1 | .1 |
| Inventories, % | 0.00839748 | 0.00613676 | 0 | 0 | 0.382 | 0.07930624 | 0.07930624 | 0.07930624 | 0.07930624 | 0.07930624 |
| Accounts Payable | 2.5 | 3.6 | .0 | 5.2 | 24.6 | 10.0 | 12.2 | 15.0 | 18.4 | 22.5 |
| Accounts Payable, % | 14.83 | 15.65 | 0.0803748 | 14.4 | 68.98 | 22.79 | 22.79 | 22.79 | 22.79 | 22.79 |
| Capital Expenditure | -.2 | .0 | -.1 | .0 | .0 | -.2 | -.2 | -.2 | -.3 | -.4 |
| Capital Expenditure, % | -1.43 | -0.11372 | -0.2197 | -0.00105052 | -0.01155652 | -0.3551 | -0.3551 | -0.3551 | -0.3551 | -0.3551 |
| Tax Rate, % | 14.62 | 14.62 | 14.62 | 14.62 | 14.62 | 14.62 | 14.62 | 14.62 | 14.62 | 14.62 |
| EBITAT | -4.1 | -4.8 | -6.9 | -3.6 | -5.0 | -7.8 | -9.6 | -11.7 | -14.4 | -17.6 |
| Depreciation | ||||||||||
| Changes in Account Receivables | ||||||||||
| Changes in Inventories | ||||||||||
| Changes in Accounts Payable | ||||||||||
| Capital Expenditure | ||||||||||
| UFCF | -7.5 | -2.9 | -6.9 | -8.2 | -7.1 | -5.5 | -11.0 | -13.4 | -16.5 | -20.2 |
| WACC, % | 4.83 | 4.83 | 4.83 | 4.83 | 4.8 | 4.83 | 4.83 | 4.83 | 4.83 | 4.83 |
| PV UFCF | ||||||||||
| SUM PV UFCF | -56.5 | |||||||||
| Long Term Growth Rate, % | 2.00 | |||||||||
| Free cash flow (T + 1) | -21 | |||||||||
| Terminal Value | -730 | |||||||||
| Present Terminal Value | -577 | |||||||||
| Enterprise Value | -633 | |||||||||
| Net Debt | 0 | |||||||||
| Equity Value | -633 | |||||||||
| Diluted Shares Outstanding, MM | 53 | |||||||||
| Equity Value Per Share | -11.88 |
What You Will Get
- Real FingerMotion Data: Preloaded financials – from revenue to EBIT – based on actual and projected figures for FingerMotion, Inc. (FNGR).
- Full Customization: Adjust all critical parameters (yellow cells) like WACC, growth %, and tax rates to fit your analysis of FingerMotion, Inc. (FNGR).
- Instant Valuation Updates: Automatic recalculations to analyze the impact of changes on FingerMotion, Inc. (FNGR)’s fair value.
- Versatile Excel Template: Tailored for quick edits, scenario testing, and detailed projections specific to FingerMotion, Inc. (FNGR).
- Time-Saving and Accurate: Skip building models from scratch while maintaining precision and flexibility for your FingerMotion, Inc. (FNGR) assessments.
Key Features
- Comprehensive DCF Calculator: Features detailed unlevered and levered DCF valuation models tailored for FingerMotion, Inc. (FNGR).
- WACC Calculator: Pre-configured Weighted Average Cost of Capital sheet with adjustable inputs specific to FNGR.
- Customizable Forecast Assumptions: Easily alter growth rates, capital expenditures, and discount rates for accurate projections.
- Integrated Financial Ratios: Assess profitability, leverage, and efficiency ratios relevant to FingerMotion, Inc. (FNGR).
- Interactive Dashboard and Charts: Visual representations summarize essential valuation metrics for streamlined analysis.
How It Works
- 1. Access the Template: Download and open the Excel file featuring FingerMotion, Inc.'s (FNGR) preloaded data.
- 2. Modify Assumptions: Adjust key inputs such as growth projections, WACC, and capital expenditures.
- 3. Analyze Results Instantly: The DCF model automatically calculates intrinsic value and NPV.
- 4. Explore Scenarios: Evaluate various forecasts to assess different valuation scenarios.
- 5. Present with Assurance: Deliver professional valuation insights to enhance your decision-making process.
Why Choose This Calculator for FingerMotion, Inc. (FNGR)?
- User-Friendly Interface: Perfect for both novices and seasoned professionals.
- Customizable Inputs: Adjust parameters easily to suit your specific analysis.
- Real-Time Feedback: Observe immediate updates to FingerMotion’s valuation as you tweak inputs.
- Preloaded Data: Comes equipped with FingerMotion’s actual financial metrics for swift evaluations.
- Widely Endorsed: Favored by investors and analysts for making well-informed choices.
Who Should Use This Product?
- Professional Investors: Develop comprehensive and trustworthy valuation models for analyzing FingerMotion, Inc. (FNGR) stocks.
- Corporate Finance Teams: Evaluate valuation scenarios to inform strategic decisions within the organization.
- Consultants and Advisors: Deliver precise valuation insights to clients regarding FingerMotion, Inc. (FNGR).
- Students and Educators: Utilize real-time data to practice and teach financial modeling concepts.
- Tech Enthusiasts: Gain insights into how technology firms like FingerMotion, Inc. (FNGR) are assessed in the marketplace.
What the Template Contains
- Comprehensive DCF Model: Editable template featuring in-depth valuation calculations.
- Real-World Data: FingerMotion, Inc.'s (FNGR) historical and projected financials preloaded for analysis.
- Customizable Parameters: Modify WACC, growth rates, and tax assumptions to explore various scenarios.
- Financial Statements: Complete annual and quarterly breakdowns for enhanced insights.
- Key Ratios: Integrated analysis for profitability, efficiency, and leverage metrics.
- Dashboard with Visual Outputs: Charts and tables designed for clear, actionable results.
Disclaimer
All information, articles, and product details provided on this website are for general informational and educational purposes only. We do not claim any ownership over, nor do we intend to infringe upon, any trademarks, copyrights, logos, brand names, or other intellectual property mentioned or depicted on this site. Such intellectual property remains the property of its respective owners, and any references here are made solely for identification or informational purposes, without implying any affiliation, endorsement, or partnership.
We make no representations or warranties, express or implied, regarding the accuracy, completeness, or suitability of any content or products presented. Nothing on this website should be construed as legal, tax, investment, financial, medical, or other professional advice. In addition, no part of this site—including articles or product references—constitutes a solicitation, recommendation, endorsement, advertisement, or offer to buy or sell any securities, franchises, or other financial instruments, particularly in jurisdictions where such activity would be unlawful.
All content is of a general nature and may not address the specific circumstances of any individual or entity. It is not a substitute for professional advice or services. Any actions you take based on the information provided here are strictly at your own risk. You accept full responsibility for any decisions or outcomes arising from your use of this website and agree to release us from any liability in connection with your use of, or reliance upon, the content or products found herein.