
|
Cedar Fair, L.P. (Fun) Avaliação DCF |
Totalmente Editável: Adapte-Se Às Suas Necessidades No Excel Ou Planilhas
Design Profissional: Modelos Confiáveis E Padrão Da Indústria
Pré-Construídos Para Uso Rápido E Eficiente
Compatível com MAC/PC, totalmente desbloqueado
Não É Necessária Experiência; Fácil De Seguir
Cedar Fair, L.P. (FUN) Bundle
Explore a Cedar Fair, L.P. (Fun) Perspectivas financeiras com nossa calculadora DCF amigável! Digite suas projeções de crescimento, margens de lucro e despesas para calcular o Cedar Fair, L.P. (divertido) valor intrínseco e refinar sua abordagem de investimento.
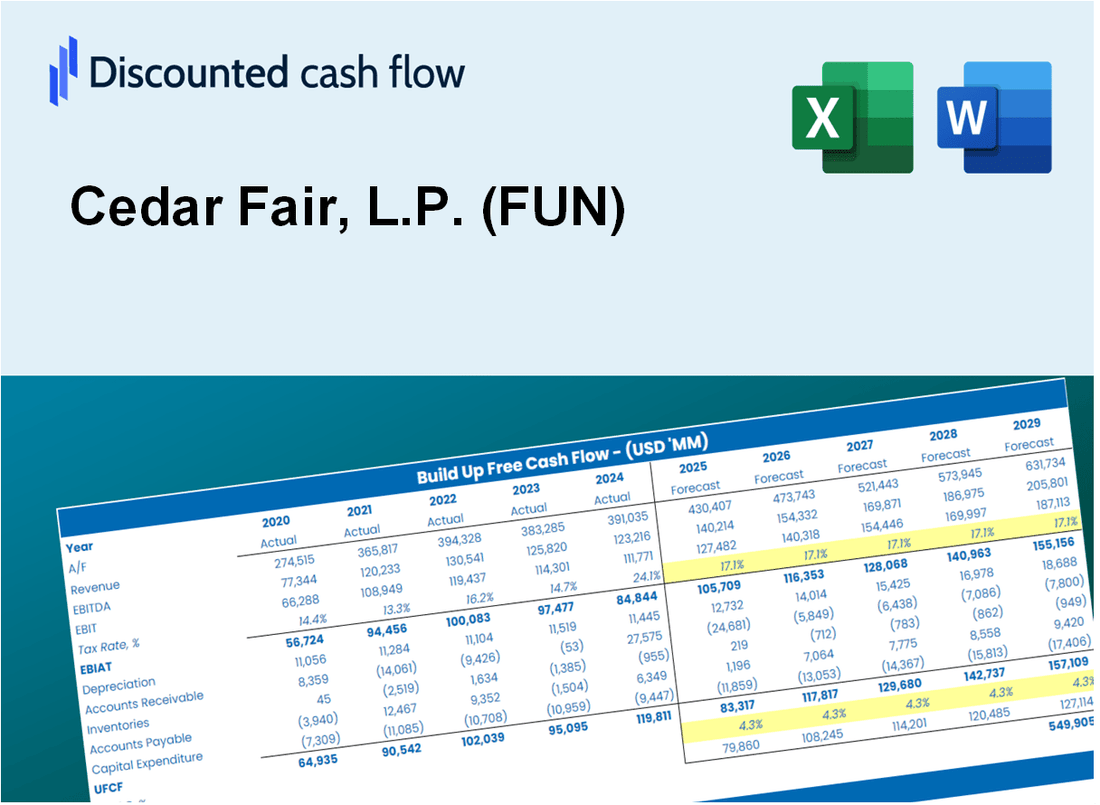
Discounted Cash Flow (DCF) - (USD MM)
| Year | AY1 2020 |
AY2 2021 |
AY3 2022 |
AY4 2023 |
AY5 2024 |
FY1 2025 |
FY2 2026 |
FY3 2027 |
FY4 2028 |
FY5 2029 |
|---|---|---|---|---|---|---|---|---|---|---|
| Revenue | 181.6 | 1,338.2 | 1,817.4 | 1,798.7 | 2,708.9 | 3,964.4 | 5,801.7 | 8,490.6 | 12,425.7 | 18,184.4 |
| Revenue Growth, % | 0 | 637.09 | 35.81 | -1.03 | 50.61 | 46.35 | 46.35 | 46.35 | 46.35 | 46.35 |
| EBITDA | -419.9 | 304.4 | 673.3 | 472.4 | 587.1 | 61.2 | 89.6 | 131.1 | 191.9 | 280.8 |
| EBITDA, % | -231.3 | 22.74 | 37.05 | 26.26 | 21.67 | 1.54 | 1.54 | 1.54 | 1.54 | 1.54 |
| Depreciation | 157.5 | 148.8 | 153.3 | 158.0 | 318.1 | 1,005.8 | 1,472.0 | 2,154.2 | 3,152.6 | 4,613.7 |
| Depreciation, % | 86.78 | 11.12 | 8.43 | 8.78 | 11.74 | 25.37 | 25.37 | 25.37 | 25.37 | 25.37 |
| EBIT | -577.5 | 155.5 | 520.0 | 314.4 | 268.9 | -256.6 | -375.5 | -549.5 | -804.2 | -1,176.9 |
| EBIT, % | -318.08 | 11.62 | 28.61 | 17.48 | 9.93 | -6.47 | -6.47 | -6.47 | -6.47 | -6.47 |
| Total Cash | 377.0 | 61.1 | 101.2 | 65.8 | 83.2 | 926.6 | 1,356.0 | 1,984.5 | 2,904.2 | 4,250.2 |
| Total Cash, percent | .0 | .0 | .0 | .0 | .0 | .0 | .0 | .0 | .0 | .0 |
| Account Receivables | 103.5 | 146.2 | 70.9 | 79.5 | 164.9 | 653.1 | 955.7 | 1,398.7 | 2,046.9 | 2,995.5 |
| Account Receivables, % | 57.03 | 10.92 | 3.9 | 4.42 | 6.09 | 16.47 | 16.47 | 16.47 | 16.47 | 16.47 |
| Inventories | 47.5 | 32.1 | 45.3 | 41.0 | 71.1 | 285.0 | 417.1 | 610.5 | 893.4 | 1,307.5 |
| Inventories, % | 26.15 | 2.4 | 2.49 | 2.28 | 2.62 | 7.19 | 7.19 | 7.19 | 7.19 | 7.19 |
| Accounts Payable | 14.3 | 53.9 | 55.0 | 37.6 | 107.1 | 166.2 | 243.2 | 355.9 | 520.8 | 762.2 |
| Accounts Payable, % | 7.86 | 4.03 | 3.03 | 2.09 | 3.95 | 4.19 | 4.19 | 4.19 | 4.19 | 4.19 |
| Capital Expenditure | -129.1 | -59.2 | -183.4 | -220.4 | -320.8 | -869.9 | -1,273.0 | -1,863.0 | -2,726.4 | -3,990.0 |
| Capital Expenditure, % | -71.1 | -4.42 | -10.09 | -12.25 | -11.84 | -21.94 | -21.94 | -21.94 | -21.94 | -21.94 |
| Tax Rate, % | 776.35 | 776.35 | 776.35 | 776.35 | 776.35 | 776.35 | 776.35 | 776.35 | 776.35 | 776.35 |
| EBITAT | -468.1 | 265.0 | 430.5 | 226.9 | -1,819.0 | -172.4 | -252.3 | -369.3 | -540.4 | -790.9 |
| Depreciation | ||||||||||
| Changes in Account Receivables | ||||||||||
| Changes in Inventories | ||||||||||
| Changes in Accounts Payable | ||||||||||
| Capital Expenditure | ||||||||||
| UFCF | -576.4 | 367.0 | 463.5 | 142.7 | -1,867.7 | -679.5 | -411.1 | -601.6 | -880.5 | -1,288.5 |
| WACC, % | 4.06 | 4.73 | 4.12 | 3.74 | 1.19 | 3.57 | 3.57 | 3.57 | 3.57 | 3.57 |
| PV UFCF | ||||||||||
| SUM PV UFCF | -3,427.5 | |||||||||
| Long Term Growth Rate, % | 3.00 | |||||||||
| Free cash flow (T + 1) | -1,327 | |||||||||
| Terminal Value | -233,346 | |||||||||
| Present Terminal Value | -195,819 | |||||||||
| Enterprise Value | -199,247 | |||||||||
| Net Debt | 5,080 | |||||||||
| Equity Value | -204,327 | |||||||||
| Diluted Shares Outstanding, MM | 100 | |||||||||
| Equity Value Per Share | -2,036.15 |
What You Will Get
- Editable Excel Template: A fully customizable Excel-based DCF Calculator featuring pre-filled real Cedar Fair, L.P. (FUN) financials.
- Real-World Data: Historical data and forward-looking estimates (as indicated in the highlighted cells).
- Forecast Flexibility: Adjust forecast assumptions such as revenue growth, EBITDA %, and WACC.
- Automatic Calculations: Instantly observe how your inputs affect Cedar Fair, L.P. (FUN)’s valuation.
- Professional Tool: Designed for investors, CFOs, consultants, and financial analysts.
- User-Friendly Design: Organized for clarity and ease of use, complete with step-by-step instructions.
Key Features
- Customizable Revenue Inputs: Adjust essential factors such as ticket pricing, attendance rates, and seasonal trends.
- Instant DCF Valuation: Quickly computes intrinsic value, NPV, and various financial metrics.
- Accurate Financial Modeling: Leverages Cedar Fair’s (FUN) actual financial data for reliable valuation results.
- Effortless Scenario Testing: Easily evaluate different business scenarios and analyze their impacts.
- Efficiency Booster: Streamlines the valuation process, removing the need for intricate model development.
How It Works
- Download: Obtain the pre-formatted Excel file featuring Cedar Fair, L.P.'s (FUN) financial data.
- Customize: Tailor your forecasts, including attendance growth, EBITDA margins, and discount rates.
- Update Automatically: The intrinsic value and NPV calculations refresh in real-time.
- Test Scenarios: Develop various projections and analyze results instantly.
- Make Decisions: Utilize the valuation findings to inform your investment approach.
Why Choose Cedar Fair, L.P. (FUN)?
- Enhance Your Experience: Enjoy thrilling amusement parks and unforgettable entertainment options.
- Strong Financial Performance: Proven track record of revenue growth and profitability in the leisure industry.
- Diverse Offerings: A wide range of attractions and events cater to all ages and interests.
- Commitment to Safety: Prioritizing guest safety with stringent health and safety protocols.
- Community Engagement: Actively involved in local communities through various outreach and support initiatives.
Who Should Use This Product?
- Finance Students: Explore amusement park valuation techniques and apply them using real data from Cedar Fair, L.P. (FUN).
- Academics: Integrate industry-specific models into your coursework or research focused on leisure and entertainment.
- Investors: Evaluate your investment strategies and analyze valuation outcomes for Cedar Fair, L.P. (FUN) stock.
- Analysts: Enhance your workflow with a customizable DCF model tailored for the entertainment sector.
- Theme Park Enthusiasts: Understand how large public companies like Cedar Fair, L.P. (FUN) are assessed in the market.
What the Template Contains
- Pre-Filled Data: Contains Cedar Fair, L.P.’s historical financials and forecasts.
- Discounted Cash Flow Model: Editable DCF valuation model with automatic calculations.
- Weighted Average Cost of Capital (WACC): A dedicated sheet for calculating WACC based on custom inputs.
- Key Financial Ratios: Analyze Cedar Fair, L.P.'s profitability, efficiency, and leverage.
- Customizable Inputs: Edit revenue growth, margins, and tax rates with ease.
- Clear Dashboard: Charts and tables summarizing key valuation results.
Disclaimer
All information, articles, and product details provided on this website are for general informational and educational purposes only. We do not claim any ownership over, nor do we intend to infringe upon, any trademarks, copyrights, logos, brand names, or other intellectual property mentioned or depicted on this site. Such intellectual property remains the property of its respective owners, and any references here are made solely for identification or informational purposes, without implying any affiliation, endorsement, or partnership.
We make no representations or warranties, express or implied, regarding the accuracy, completeness, or suitability of any content or products presented. Nothing on this website should be construed as legal, tax, investment, financial, medical, or other professional advice. In addition, no part of this site—including articles or product references—constitutes a solicitation, recommendation, endorsement, advertisement, or offer to buy or sell any securities, franchises, or other financial instruments, particularly in jurisdictions where such activity would be unlawful.
All content is of a general nature and may not address the specific circumstances of any individual or entity. It is not a substitute for professional advice or services. Any actions you take based on the information provided here are strictly at your own risk. You accept full responsibility for any decisions or outcomes arising from your use of this website and agree to release us from any liability in connection with your use of, or reliance upon, the content or products found herein.