
|
Gabriel India Limited (Gabriel.NS) Avaliação DCF |
Totalmente Editável: Adapte-Se Às Suas Necessidades No Excel Ou Planilhas
Design Profissional: Modelos Confiáveis E Padrão Da Indústria
Pré-Construídos Para Uso Rápido E Eficiente
Compatível com MAC/PC, totalmente desbloqueado
Não É Necessária Experiência; Fácil De Seguir
Gabriel India Limited (GABRIEL.NS) Bundle
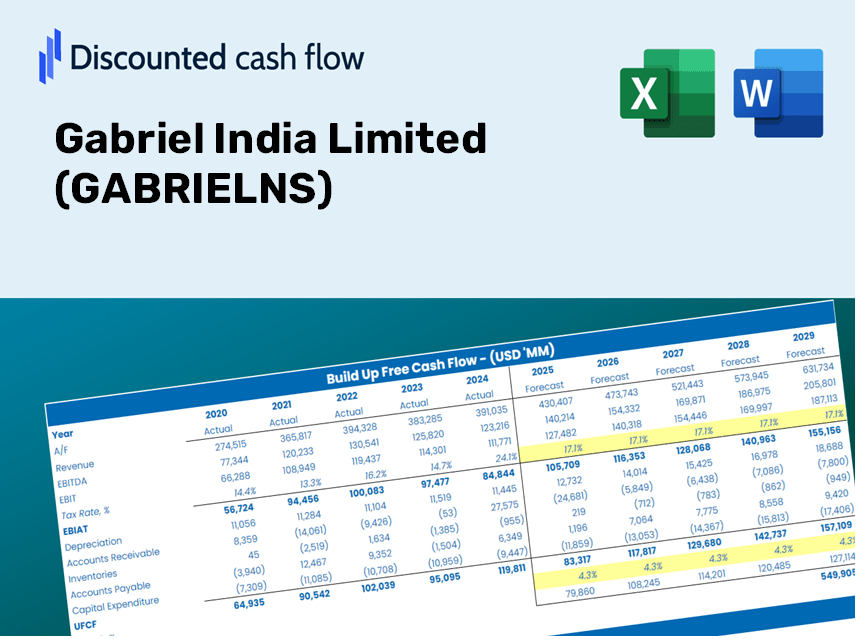
Seja você um investidor ou analista, esta calculadora DCF (Gabrielns) é sua ferramenta preferida para uma avaliação precisa. Pré -carregado com dados reais da Gabriel India Limited, você pode ajustar as previsões e observar instantaneamente os efeitos.
Discounted Cash Flow (DCF) - (USD MM)
| Year | AY1 2021 |
AY2 2022 |
AY3 2023 |
AY4 2024 |
AY5 2025 |
FY1 2026 |
FY2 2027 |
FY3 2028 |
FY4 2029 |
FY5 2030 |
|---|---|---|---|---|---|---|---|---|---|---|
| Revenue | 16,948.3 | 23,145.1 | 29,717.4 | 34,026.3 | 40,633.8 | 50,678.2 | 63,205.5 | 78,829.5 | 98,315.5 | 122,618.5 |
| Revenue Growth, % | 0 | 36.56 | 28.4 | 14.5 | 19.42 | 24.72 | 24.72 | 24.72 | 24.72 | 24.72 |
| EBITDA | 1,259.8 | 1,712.5 | 2,310.4 | 3,119.2 | 4,156.3 | 4,257.2 | 5,309.5 | 6,622.0 | 8,258.9 | 10,300.5 |
| EBITDA, % | 7.43 | 7.4 | 7.77 | 9.17 | 10.23 | 8.4 | 8.4 | 8.4 | 8.4 | 8.4 |
| Depreciation | 423.5 | 413.2 | 485.5 | 599.5 | 812.8 | 981.1 | 1,223.6 | 1,526.1 | 1,903.3 | 2,373.8 |
| Depreciation, % | 2.5 | 1.79 | 1.63 | 1.76 | 2 | 1.94 | 1.94 | 1.94 | 1.94 | 1.94 |
| EBIT | 836.4 | 1,299.3 | 1,824.9 | 2,519.7 | 3,343.4 | 3,276.1 | 4,085.9 | 5,095.9 | 6,355.6 | 7,926.7 |
| EBIT, % | 4.93 | 5.61 | 6.14 | 7.41 | 8.23 | 6.46 | 6.46 | 6.46 | 6.46 | 6.46 |
| Total Cash | 2,687.4 | 2,789.3 | 2,983.7 | 3,029.8 | 2,544.0 | 5,383.4 | 6,714.1 | 8,373.8 | 10,443.7 | 13,025.4 |
| Total Cash, percent | .0 | .0 | .0 | .0 | .0 | .0 | .0 | .0 | .0 | .0 |
| Account Receivables | 2,895.7 | 3,873.4 | 3,885.3 | 4,960.9 | 6,006.8 | 7,729.2 | 9,639.8 | 12,022.7 | 14,994.6 | 18,701.2 |
| Account Receivables, % | 17.09 | 16.74 | 13.07 | 14.58 | 14.78 | 15.25 | 15.25 | 15.25 | 15.25 | 15.25 |
| Inventories | 1,964.8 | 2,099.8 | 2,248.1 | 3,015.2 | 3,639.1 | 4,667.2 | 5,820.9 | 7,259.7 | 9,054.3 | 11,292.5 |
| Inventories, % | 11.59 | 9.07 | 7.56 | 8.86 | 8.96 | 9.21 | 9.21 | 9.21 | 9.21 | 9.21 |
| Accounts Payable | 3,916.1 | 4,731.4 | 4,404.5 | 5,877.4 | 6,261.7 | 9,228.8 | 11,510.1 | 14,355.3 | 17,903.8 | 22,329.6 |
| Accounts Payable, % | 23.11 | 20.44 | 14.82 | 17.27 | 15.41 | 18.21 | 18.21 | 18.21 | 18.21 | 18.21 |
| Capital Expenditure | -526.1 | -776.5 | -886.7 | -1,627.8 | -1,758.7 | -1,880.6 | -2,345.5 | -2,925.3 | -3,648.4 | -4,550.3 |
| Capital Expenditure, % | -3.1 | -3.35 | -2.98 | -4.78 | -4.33 | -3.71 | -3.71 | -3.71 | -3.71 | -3.71 |
| Tax Rate, % | 24.43 | 24.43 | 24.43 | 24.43 | 24.43 | 24.43 | 24.43 | 24.43 | 24.43 | 24.43 |
| EBITAT | 647.1 | 919.7 | 1,357.6 | 1,847.1 | 2,526.7 | 2,433.6 | 3,035.2 | 3,785.5 | 4,721.3 | 5,888.3 |
| Depreciation | ||||||||||
| Changes in Account Receivables | ||||||||||
| Changes in Inventories | ||||||||||
| Changes in Accounts Payable | ||||||||||
| Capital Expenditure | ||||||||||
| UFCF | -400.0 | 259.1 | 469.3 | 449.0 | 295.3 | 1,750.7 | 1,130.3 | 1,409.7 | 1,758.2 | 2,192.8 |
| WACC, % | 6.19 | 6.19 | 6.19 | 6.19 | 6.19 | 6.19 | 6.19 | 6.19 | 6.19 | 6.19 |
| PV UFCF | ||||||||||
| SUM PV UFCF | 6,834.8 | |||||||||
| Long Term Growth Rate, % | 4.00 | |||||||||
| Free cash flow (T + 1) | 2,281 | |||||||||
| Terminal Value | 104,048 | |||||||||
| Present Terminal Value | 77,051 | |||||||||
| Enterprise Value | 83,886 | |||||||||
| Net Debt | 297 | |||||||||
| Equity Value | 83,589 | |||||||||
| Diluted Shares Outstanding, MM | 144 | |||||||||
| Equity Value Per Share | 581.76 |
What You Will Receive
- Accurate GABRIEL Financials: Access to historical and projected data for precise valuation.
- Customizable Inputs: Adjust WACC, tax rates, revenue growth, and capital expenditures as needed.
- Real-Time Calculations: Intrinsic value and NPV are calculated automatically.
- Scenario Analysis: Explore various scenarios to assess Gabriel India Limited's future performance.
- User-Friendly Design: Designed for professionals while remaining accessible to newcomers.
Key Features
- Accurate Financial Insights: Gain access to reliable historical data and future forecasts for Gabriel India Limited (GABRIELNS).
- Tailorable Forecast Parameters: Modify the highlighted cells such as WACC, growth rates, and profit margins.
- Automated Calculations: Real-time updates for DCF, Net Present Value (NPV), and cash flow assessments.
- Interactive Dashboard: User-friendly charts and summaries to help you visualize your valuation findings.
- Designed for All Skill Levels: A straightforward, user-centric layout perfect for investors, CFOs, and consultants alike.
How It Works
- Step 1: Download the Excel file for Gabriel India Limited (GABRIELNS).
- Step 2: Review the pre-filled financial data and forecasts for Gabriel India.
- Step 3: Adjust key inputs such as revenue growth, WACC, and tax rates (highlighted cells).
- Step 4: Observe the DCF model update in real-time as you modify your assumptions.
- Step 5: Analyze the results and leverage them for your investment strategies.
Why Choose This Calculator for Gabriel India Limited (GABRIELNS)?
- User-Friendly Interface: Ideal for both novices and seasoned professionals.
- Customizable Inputs: Adjust parameters easily to suit your financial analysis.
- Real-Time Adjustments: Observe immediate updates to Gabriel India’s valuation as you tweak inputs.
- Preloaded Data: Comes equipped with Gabriel India’s actual financial metrics for swift evaluations.
- Favored by Experts: Utilized by analysts and investors for making well-informed decisions.
Who Can Benefit from This Product?
- Investors: Assess Gabriel India Limited’s (GABRIELNS) valuation before making stock transactions.
- CFOs and Financial Analysts: Enhance valuation processes and validate forecasts.
- Startup Founders: Discover how large public companies like Gabriel India Limited are valued.
- Consultants: Provide comprehensive valuation reports for your clients.
- Students and Educators: Utilize real-life data to practice and teach valuation methodologies.
Contents of the Template
- Preloaded GABRIELNS Data: Historical and forecasted financial information, including revenue, EBIT, and capital expenditures.
- DCF and WACC Models: Advanced spreadsheets for determining intrinsic value and Weighted Average Cost of Capital.
- Editable Inputs: Cells highlighted in yellow for modifying revenue growth, tax rates, and discount rates.
- Financial Statements: Detailed annual and quarterly financial reports for in-depth analysis.
- Key Ratios: Ratios focusing on profitability, leverage, and efficiency to assess performance.
- Dashboard and Charts: Visual representations of valuation results and underlying assumptions.
Disclaimer
All information, articles, and product details provided on this website are for general informational and educational purposes only. We do not claim any ownership over, nor do we intend to infringe upon, any trademarks, copyrights, logos, brand names, or other intellectual property mentioned or depicted on this site. Such intellectual property remains the property of its respective owners, and any references here are made solely for identification or informational purposes, without implying any affiliation, endorsement, or partnership.
We make no representations or warranties, express or implied, regarding the accuracy, completeness, or suitability of any content or products presented. Nothing on this website should be construed as legal, tax, investment, financial, medical, or other professional advice. In addition, no part of this site—including articles or product references—constitutes a solicitation, recommendation, endorsement, advertisement, or offer to buy or sell any securities, franchises, or other financial instruments, particularly in jurisdictions where such activity would be unlawful.
All content is of a general nature and may not address the specific circumstances of any individual or entity. It is not a substitute for professional advice or services. Any actions you take based on the information provided here are strictly at your own risk. You accept full responsibility for any decisions or outcomes arising from your use of this website and agree to release us from any liability in connection with your use of, or reliance upon, the content or products found herein.