
|
Galaxy Surfactants Limited (Galaxysurf.NS) Avaliação DCF |
Totalmente Editável: Adapte-Se Às Suas Necessidades No Excel Ou Planilhas
Design Profissional: Modelos Confiáveis E Padrão Da Indústria
Pré-Construídos Para Uso Rápido E Eficiente
Compatível com MAC/PC, totalmente desbloqueado
Não É Necessária Experiência; Fácil De Seguir
Galaxy Surfactants Limited (GALAXYSURF.NS) Bundle
Procurando determinar o valor intrínseco dos surfactantes de galáxias limitado? Nossa calculadora DCF (Galaxysurfns) integra dados do mundo real com extensos recursos de personalização, permitindo ajustar as projeções e aprimorar suas opções de investimento.
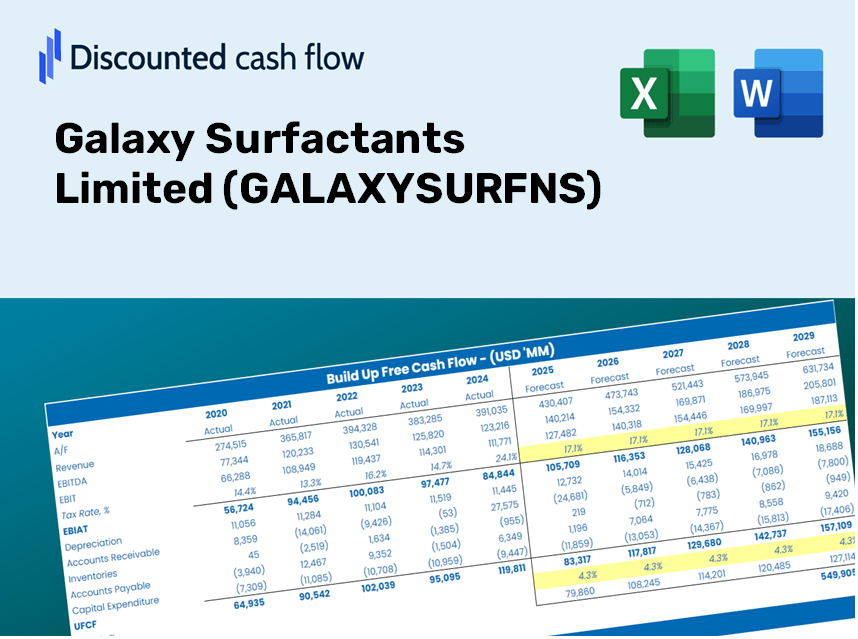
Discounted Cash Flow (DCF) - (USD MM)
| Year | AY1 2021 |
AY2 2022 |
AY3 2023 |
AY4 2024 |
AY5 2025 |
FY1 2026 |
FY2 2027 |
FY3 2028 |
FY4 2029 |
FY5 2030 |
|---|---|---|---|---|---|---|---|---|---|---|
| Revenue | 27,453.5 | 36,527.2 | 44,452.4 | 37,647.3 | 42,236.7 | 47,688.4 | 53,843.7 | 60,793.5 | 68,640.4 | 77,500.1 |
| Revenue Growth, % | 0 | 33.05 | 21.7 | -15.31 | 12.19 | 12.91 | 12.91 | 12.91 | 12.91 | 12.91 |
| EBITDA | 4,579.8 | 4,108.5 | 5,746.5 | 4,976.8 | 4,842.3 | 6,251.1 | 7,058.0 | 7,969.0 | 8,997.6 | 10,158.9 |
| EBITDA, % | 16.68 | 11.25 | 12.93 | 13.22 | 11.46 | 13.11 | 13.11 | 13.11 | 13.11 | 13.11 |
| Depreciation | 739.5 | 710.6 | 833.5 | 998.1 | 1,103.4 | 1,123.3 | 1,268.3 | 1,432.0 | 1,616.9 | 1,825.5 |
| Depreciation, % | 2.69 | 1.95 | 1.88 | 2.65 | 2.61 | 2.36 | 2.36 | 2.36 | 2.36 | 2.36 |
| EBIT | 3,840.3 | 3,397.9 | 4,913.0 | 3,978.7 | 3,738.9 | 5,127.8 | 5,789.7 | 6,537.0 | 7,380.7 | 8,333.4 |
| EBIT, % | 13.99 | 9.3 | 11.05 | 10.57 | 8.85 | 10.75 | 10.75 | 10.75 | 10.75 | 10.75 |
| Total Cash | 1,538.8 | 692.4 | 2,465.2 | 4,381.4 | 5,004.8 | 3,484.5 | 3,934.2 | 4,442.0 | 5,015.4 | 5,662.7 |
| Total Cash, percent | .0 | .0 | .0 | .0 | .0 | .0 | .0 | .0 | .0 | .0 |
| Account Receivables | 4,802.8 | 6,448.2 | 6,197.5 | 5,930.9 | 7,000.0 | 7,765.2 | 8,767.5 | 9,899.2 | 11,176.9 | 12,619.6 |
| Account Receivables, % | 17.49 | 17.65 | 13.94 | 15.75 | 16.57 | 16.28 | 16.28 | 16.28 | 16.28 | 16.28 |
| Inventories | 4,278.1 | 7,117.8 | 6,458.2 | 5,560.5 | 7,238.8 | 7,773.8 | 8,777.2 | 9,910.1 | 11,189.3 | 12,633.5 |
| Inventories, % | 15.58 | 19.49 | 14.53 | 14.77 | 17.14 | 16.3 | 16.3 | 16.3 | 16.3 | 16.3 |
| Accounts Payable | 3,769.6 | 5,189.2 | 4,301.9 | 4,461.2 | 6,199.5 | 6,117.7 | 6,907.4 | 7,798.9 | 8,805.6 | 9,942.1 |
| Accounts Payable, % | 13.73 | 14.21 | 9.68 | 11.85 | 14.68 | 12.83 | 12.83 | 12.83 | 12.83 | 12.83 |
| Capital Expenditure | -1,075.5 | -1,551.7 | -1,460.8 | -1,582.5 | -1,839.6 | -1,908.6 | -2,154.9 | -2,433.0 | -2,747.1 | -3,101.7 |
| Capital Expenditure, % | -3.92 | -4.25 | -3.29 | -4.2 | -4.36 | -4 | -4 | -4 | -4 | -4 |
| Tax Rate, % | 19.86 | 19.86 | 19.86 | 19.86 | 19.86 | 19.86 | 19.86 | 19.86 | 19.86 | 19.86 |
| EBITAT | 3,116.4 | 2,711.4 | 3,957.6 | 3,194.6 | 2,996.5 | 4,122.1 | 4,654.2 | 5,254.9 | 5,933.2 | 6,699.0 |
| Depreciation | ||||||||||
| Changes in Account Receivables | ||||||||||
| Changes in Inventories | ||||||||||
| Changes in Accounts Payable | ||||||||||
| Capital Expenditure | ||||||||||
| UFCF | -2,530.9 | -1,195.2 | 3,353.3 | 3,933.8 | 1,251.2 | 1,954.9 | 2,551.5 | 2,880.9 | 3,252.7 | 3,672.5 |
| WACC, % | 4.76 | 4.75 | 4.76 | 4.76 | 4.76 | 4.76 | 4.76 | 4.76 | 4.76 | 4.76 |
| PV UFCF | ||||||||||
| SUM PV UFCF | 12,309.6 | |||||||||
| Long Term Growth Rate, % | 3.00 | |||||||||
| Free cash flow (T + 1) | 3,783 | |||||||||
| Terminal Value | 215,464 | |||||||||
| Present Terminal Value | 170,800 | |||||||||
| Enterprise Value | 183,110 | |||||||||
| Net Debt | -56 | |||||||||
| Equity Value | 183,166 | |||||||||
| Diluted Shares Outstanding, MM | 35 | |||||||||
| Equity Value Per Share | 5,166.14 |
What You Will Gain
- Authentic GALAXYSURFNS Financials: Comprehensive historical and projected data for precise valuation.
- Customizable Inputs: Adjust WACC, tax rates, revenue growth, and capital expenditures to suit your analysis.
- Automated Calculations: Dynamic computation of intrinsic value and NPV.
- Scenario Analysis: Evaluate various scenarios to assess Galaxy Surfactants' future prospects.
- User-Friendly Design: Tailored for professionals while remaining approachable for newcomers.
Key Features
- Customizable Forecast Inputs: Adjust essential parameters like revenue growth, EBITDA %, and capital investments.
- Instant DCF Valuation: Effortlessly calculates intrinsic value, NPV, and other key metrics.
- High Precision Accuracy: Utilizes Galaxy Surfactants Limited's real financial data for reliable valuation results.
- Simplified Scenario Analysis: Easily evaluate various assumptions and compare results in a user-friendly manner.
- Efficiency Booster: Remove the hassle of creating intricate valuation models from the ground up.
How It Works
- Step 1: Download the prebuilt Excel template featuring Galaxy Surfactants Limited's data.
- Step 2: Navigate through the pre-filled sheets to familiarize yourself with the essential metrics.
- Step 3: Modify forecasts and assumptions in the editable yellow cells (WACC, growth, margins).
- Step 4: Instantly access updated results, including Galaxy Surfactants Limited's intrinsic value.
- Step 5: Utilize the outputs to make well-informed investment decisions or create detailed reports.
Why Choose Galaxy Surfactants Limited (GALAXYSURFNS)?
- Save Time: Skip the hassle of building a financial model from ground zero – our tools are ready for immediate use.
- Enhance Accuracy: Access to trustworthy financial data and formulas minimizes errors in your evaluations.
- Completely Customizable: Adjust the model to fit your specific assumptions and forecasts.
- Simple to Analyze: Intuitive charts and outputs simplify the interpretation of results.
- Endorsed by Professionals: Crafted for experts who prioritize accuracy and functionality.
Who Should Use This Product?
- Professional Investors: Develop comprehensive and trustworthy valuation models for portfolio assessment of Galaxy Surfactants Limited (GALAXYSURFNS).
- Corporate Finance Teams: Evaluate valuation scenarios to shape internal strategic decisions for Galaxy Surfactants Limited (GALAXYSURFNS).
- Consultants and Advisors: Equip clients with precise valuation insights regarding Galaxy Surfactants Limited (GALAXYSURFNS).
- Students and Educators: Utilize real-world data for hands-on practice and instruction in financial modeling involving Galaxy Surfactants Limited (GALAXYSURFNS).
- Industry Enthusiasts: Gain insights into how companies like Galaxy Surfactants Limited (GALAXYSURFNS) are valued in the market.
Contents of the Template
- Pre-Filled Data: Features Galaxy Surfactants Limited's (GALAXYSURFNS) historical financials and projections.
- Discounted Cash Flow Model: Customizable DCF valuation model with automatic calculation capabilities.
- Weighted Average Cost of Capital (WACC): A specific sheet for computing WACC using tailored inputs.
- Key Financial Ratios: Evaluate Galaxy Surfactants Limited's profitability, efficiency, and financial leverage.
- Customizable Inputs: Easily modify revenue growth, profit margins, and tax rates.
- Clear Dashboard: Visual representations and tables summarizing essential valuation outcomes.
Disclaimer
All information, articles, and product details provided on this website are for general informational and educational purposes only. We do not claim any ownership over, nor do we intend to infringe upon, any trademarks, copyrights, logos, brand names, or other intellectual property mentioned or depicted on this site. Such intellectual property remains the property of its respective owners, and any references here are made solely for identification or informational purposes, without implying any affiliation, endorsement, or partnership.
We make no representations or warranties, express or implied, regarding the accuracy, completeness, or suitability of any content or products presented. Nothing on this website should be construed as legal, tax, investment, financial, medical, or other professional advice. In addition, no part of this site—including articles or product references—constitutes a solicitation, recommendation, endorsement, advertisement, or offer to buy or sell any securities, franchises, or other financial instruments, particularly in jurisdictions where such activity would be unlawful.
All content is of a general nature and may not address the specific circumstances of any individual or entity. It is not a substitute for professional advice or services. Any actions you take based on the information provided here are strictly at your own risk. You accept full responsibility for any decisions or outcomes arising from your use of this website and agree to release us from any liability in connection with your use of, or reliance upon, the content or products found herein.