
|
Galp Energia, SGPS, S.A. (Galp.LS) DCF Avaliação |
Totalmente Editável: Adapte-Se Às Suas Necessidades No Excel Ou Planilhas
Design Profissional: Modelos Confiáveis E Padrão Da Indústria
Pré-Construídos Para Uso Rápido E Eficiente
Compatível com MAC/PC, totalmente desbloqueado
Não É Necessária Experiência; Fácil De Seguir
Galp Energia, SGPS, S.A. (GALP.LS) Bundle
Procurando avaliar o valor intrínseco de Galp Energia, SGPS, S.A.? Nossa calculadora DCF (GALPLS) integra dados reais de mercado com extensos recursos de personalização, permitindo refinar suas previsões e aprimorar suas opções de investimento.
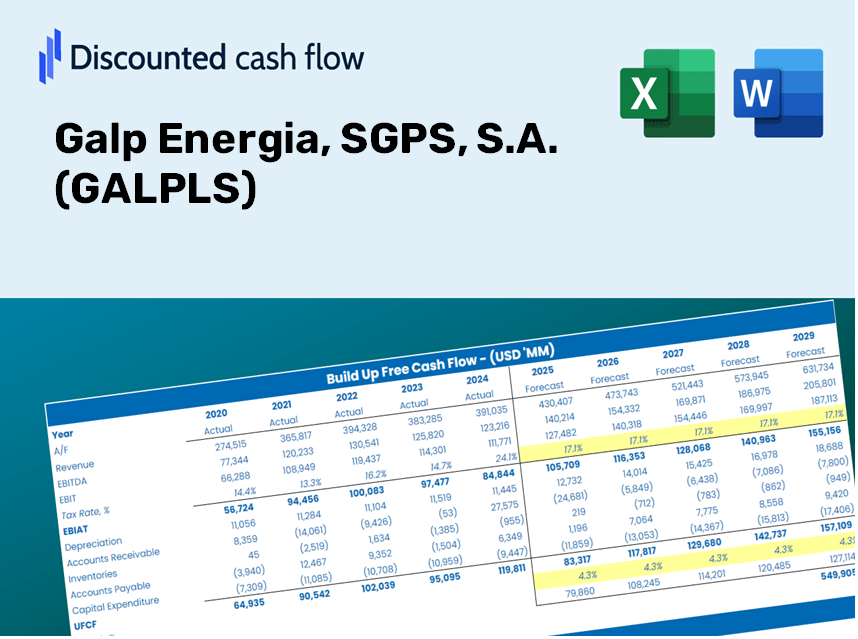
Discounted Cash Flow (DCF) - (USD MM)
| Year | AY1 2020 |
AY2 2021 |
AY3 2022 |
AY4 2023 |
AY5 2024 |
FY1 2025 |
FY2 2026 |
FY3 2027 |
FY4 2028 |
FY5 2029 |
|---|---|---|---|---|---|---|---|---|---|---|
| Revenue | 11,389.0 | 16,111.0 | 26,839.0 | 20,769.0 | 21,311.0 | 26,001.7 | 31,724.8 | 38,707.6 | 47,227.4 | 57,622.5 |
| Revenue Growth, % | 0 | 41.46 | 66.59 | -22.62 | 2.61 | 22.01 | 22.01 | 22.01 | 22.01 | 22.01 |
| EBITDA | 1,193.0 | 1,812.0 | 4,541.0 | 3,748.0 | 3,498.0 | 3,801.5 | 4,638.3 | 5,659.2 | 6,904.8 | 8,424.6 |
| EBITDA, % | 10.48 | 11.25 | 16.92 | 18.05 | 16.41 | 14.62 | 14.62 | 14.62 | 14.62 | 14.62 |
| Depreciation | 1,289.0 | 961.0 | 1,380.0 | 987.0 | 946.0 | 1,644.1 | 2,006.0 | 2,447.6 | 2,986.3 | 3,643.6 |
| Depreciation, % | 11.32 | 5.96 | 5.14 | 4.75 | 4.44 | 6.32 | 6.32 | 6.32 | 6.32 | 6.32 |
| EBIT | -96.0 | 851.0 | 3,161.0 | 2,761.0 | 2,552.0 | 2,157.4 | 2,632.3 | 3,211.6 | 3,918.5 | 4,781.0 |
| EBIT, % | -0.84292 | 5.28 | 11.78 | 13.29 | 11.98 | 8.3 | 8.3 | 8.3 | 8.3 | 8.3 |
| Total Cash | 1,827.0 | 2,934.0 | 2,737.0 | 2,366.0 | 2,395.0 | 3,488.4 | 4,256.3 | 5,193.1 | 6,336.1 | 7,730.8 |
| Total Cash, percent | .0 | .0 | .0 | .0 | .0 | .0 | .0 | .0 | .0 | .0 |
| Account Receivables | 964.0 | 2,154.0 | 1,865.0 | 2,213.0 | 1,978.0 | 2,533.6 | 3,091.3 | 3,771.7 | 4,601.8 | 5,614.7 |
| Account Receivables, % | 8.46 | 13.37 | 6.95 | 10.66 | 9.28 | 9.74 | 9.74 | 9.74 | 9.74 | 9.74 |
| Inventories | 708.0 | 1,008.0 | 1,363.0 | 1,447.0 | 1,101.0 | 1,543.7 | 1,883.5 | 2,298.1 | 2,803.9 | 3,421.0 |
| Inventories, % | 6.22 | 6.26 | 5.08 | 6.97 | 5.17 | 5.94 | 5.94 | 5.94 | 5.94 | 5.94 |
| Accounts Payable | 650.0 | 811.0 | 1,005.0 | 1,268.0 | 945.0 | 1,301.4 | 1,587.8 | 1,937.3 | 2,363.8 | 2,884.0 |
| Accounts Payable, % | 5.71 | 5.03 | 3.74 | 6.11 | 4.43 | 5.01 | 5.01 | 5.01 | 5.01 | 5.01 |
| Capital Expenditure | -649.0 | -779.0 | -1,078.0 | -1,056.0 | -1,377.0 | -1,357.1 | -1,655.8 | -2,020.2 | -2,464.9 | -3,007.5 |
| Capital Expenditure, % | -5.7 | -4.84 | -4.02 | -5.08 | -6.46 | -5.22 | -5.22 | -5.22 | -5.22 | -5.22 |
| Tax Rate, % | 55.56 | 55.56 | 55.56 | 55.56 | 55.56 | 55.56 | 55.56 | 55.56 | 55.56 | 55.56 |
| EBITAT | -189.7 | 192.8 | 1,436.4 | 1,326.6 | 1,134.2 | 1,124.4 | 1,371.9 | 1,673.8 | 2,042.2 | 2,491.8 |
| Depreciation | ||||||||||
| Changes in Account Receivables | ||||||||||
| Changes in Inventories | ||||||||||
| Changes in Accounts Payable | ||||||||||
| Capital Expenditure | ||||||||||
| UFCF | -571.7 | -954.2 | 1,866.4 | 1,088.6 | 961.2 | 769.5 | 1,111.1 | 1,355.7 | 1,654.0 | 2,018.1 |
| WACC, % | 5.68 | 4.63 | 4.94 | 4.98 | 4.93 | 5.03 | 5.03 | 5.03 | 5.03 | 5.03 |
| PV UFCF | ||||||||||
| SUM PV UFCF | 5,847.9 | |||||||||
| Long Term Growth Rate, % | 0.50 | |||||||||
| Free cash flow (T + 1) | 2,028 | |||||||||
| Terminal Value | 44,759 | |||||||||
| Present Terminal Value | 35,018 | |||||||||
| Enterprise Value | 40,865 | |||||||||
| Net Debt | 2,623 | |||||||||
| Equity Value | 38,242 | |||||||||
| Diluted Shares Outstanding, MM | 761 | |||||||||
| Equity Value Per Share | 50.26 |
What You Will Receive
- Adjustable Forecast Inputs: Flexibly modify assumptions (growth %, margins, WACC) to generate diverse scenarios.
- Industry-Specific Data: Galp Energia’s financial data pre-loaded to kickstart your analysis.
- Automatic DCF Results: The template computes Net Present Value (NPV) and intrinsic value for you effortlessly.
- Professional and Tailorable: A refined Excel model that aligns with your valuation requirements.
- Designed for Analysts and Investors: Perfect for evaluating projections, corroborating strategies, and optimizing efficiency.
Key Features
- 🔍 Real-Life GALPLS Financials: Pre-filled historical and projected data for Galp Energia, SGPS, S.A.
- ✏️ Fully Customizable Inputs: Adjust all critical parameters (yellow cells) such as WACC, growth %, and tax rates.
- 📊 Professional DCF Valuation: Integrated formulas calculate Galp Energia’s intrinsic value using the Discounted Cash Flow method.
- ⚡ Instant Results: Visualize Galp Energia’s valuation immediately after adjustments.
- Scenario Analysis: Evaluate and compare results for different financial assumptions side-by-side.
How It Functions
- 1. Access the Template: Download and open the Excel sheet containing Galp Energia’s pre-loaded data.
- 2. Adjust Assumptions: Modify key parameters, such as growth rates, WACC, and capital expenditures.
- 3. See Results Instantly: The DCF model automatically computes the intrinsic value and NPV.
- 4. Explore Scenarios: Evaluate various forecasts to investigate different valuation outcomes.
- 5. Utilize with Confidence: Deliver professional valuation insights to back your decisions regarding Galp Energia, SGPS, S.A. (GALPLS).
Why Choose This Calculator for Galp Energia (GALPLS)?
- User-Friendly Interface: Perfect for both beginners and seasoned professionals.
- Customizable Parameters: Adjust inputs effortlessly to suit your analysis needs.
- Real-Time Updates: Monitor immediate changes to Galp Energia’s valuation as you tweak the inputs.
- Pre-Configured: Comes loaded with Galp Energia’s latest financial data for fast evaluations.
- Favored by Experts: Widely utilized by investors and analysts for making informed strategic choices.
Who Can Benefit from This Product?
- Individual Investors: Make well-informed choices when trading Galp Energia (GALPLS) stock.
- Financial Analysts: Enhance valuation efficiency with pre-built financial models specific to Galp Energia.
- Consultants: Provide clients with rapid and precise valuation insights related to Galp Energia (GALPLS).
- Business Owners: Gain an understanding of how major firms like Galp Energia are valued to inform your strategic decisions.
- Finance Students: Explore valuation methodologies using real-world examples and data from Galp Energia (GALPLS).
What the Template Contains
- Historical Data: Comprehensive overview of Galp Energia's past financial performance and foundational forecasts.
- DCF and Levered DCF Models: Detailed templates for determining the intrinsic value of Galp Energia (GALPLS).
- WACC Sheet: Pre-calculated metrics for Weighted Average Cost of Capital specific to Galp Energia (GALPLS).
- Editable Inputs: Customize essential parameters such as growth rates, EBITDA %, and CAPEX assumptions.
- Quarterly and Annual Statements: An in-depth analysis of Galp Energia's (GALPLS) financial statements.
- Interactive Dashboard: Dynamic visualization of valuation outcomes and projections for Galp Energia (GALPLS).
Disclaimer
All information, articles, and product details provided on this website are for general informational and educational purposes only. We do not claim any ownership over, nor do we intend to infringe upon, any trademarks, copyrights, logos, brand names, or other intellectual property mentioned or depicted on this site. Such intellectual property remains the property of its respective owners, and any references here are made solely for identification or informational purposes, without implying any affiliation, endorsement, or partnership.
We make no representations or warranties, express or implied, regarding the accuracy, completeness, or suitability of any content or products presented. Nothing on this website should be construed as legal, tax, investment, financial, medical, or other professional advice. In addition, no part of this site—including articles or product references—constitutes a solicitation, recommendation, endorsement, advertisement, or offer to buy or sell any securities, franchises, or other financial instruments, particularly in jurisdictions where such activity would be unlawful.
All content is of a general nature and may not address the specific circumstances of any individual or entity. It is not a substitute for professional advice or services. Any actions you take based on the information provided here are strictly at your own risk. You accept full responsibility for any decisions or outcomes arising from your use of this website and agree to release us from any liability in connection with your use of, or reliance upon, the content or products found herein.