
|
Gamma Communications Plc (GAMA.L) Avaliação DCF |
Totalmente Editável: Adapte-Se Às Suas Necessidades No Excel Ou Planilhas
Design Profissional: Modelos Confiáveis E Padrão Da Indústria
Pré-Construídos Para Uso Rápido E Eficiente
Compatível com MAC/PC, totalmente desbloqueado
Não É Necessária Experiência; Fácil De Seguir
Gamma Communications plc (GAMA.L) Bundle
Procurando determinar o valor intrínseco do Gamma Communications PLC? Nossa calculadora DCF GAMAL integra dados do mundo real com recursos abrangentes de personalização, permitindo refinar suas previsões e fazer escolhas de investimento mais informadas.
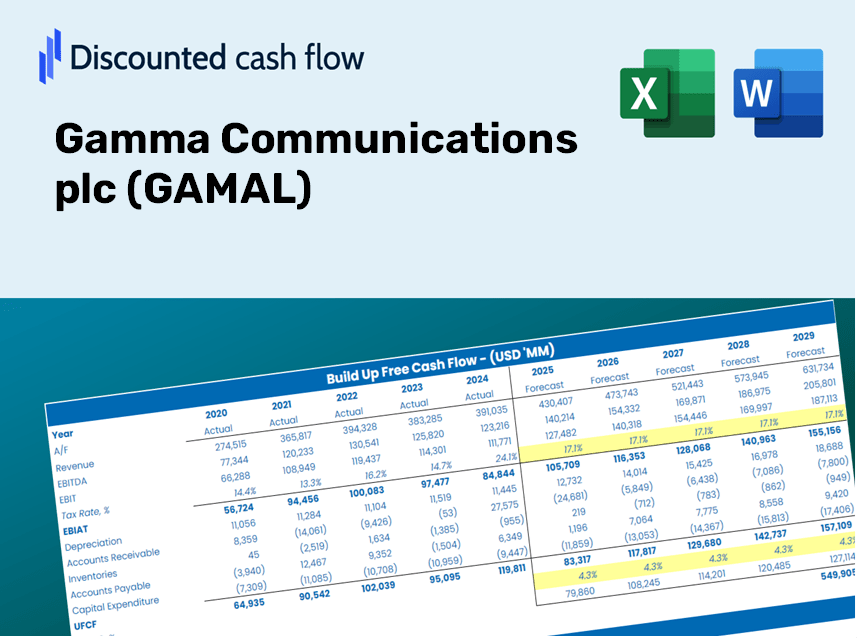
Discounted Cash Flow (DCF) - (USD MM)
| Year | AY1 2020 |
AY2 2021 |
AY3 2022 |
AY4 2023 |
AY5 2024 |
FY1 2025 |
FY2 2026 |
FY3 2027 |
FY4 2028 |
FY5 2029 |
|---|---|---|---|---|---|---|---|---|---|---|
| Revenue | 393.8 | 447.7 | 484.6 | 521.7 | 579.4 | 638.3 | 703.1 | 774.6 | 853.3 | 940.0 |
| Revenue Growth, % | 0 | 13.69 | 8.24 | 7.66 | 11.06 | 10.16 | 10.16 | 10.16 | 10.16 | 10.16 |
| EBITDA | 98.7 | 95.5 | 92.6 | 103.3 | 129.7 | 137.5 | 151.4 | 166.8 | 183.8 | 202.5 |
| EBITDA, % | 25.06 | 21.33 | 19.11 | 19.8 | 22.39 | 21.54 | 21.54 | 21.54 | 21.54 | 21.54 |
| Depreciation | 22.9 | 27.1 | 27.2 | 31.3 | 33.8 | 37.4 | 41.2 | 45.4 | 50.0 | 55.1 |
| Depreciation, % | 5.82 | 6.05 | 5.61 | 6 | 5.83 | 5.86 | 5.86 | 5.86 | 5.86 | 5.86 |
| EBIT | 75.8 | 68.4 | 65.4 | 72.0 | 95.9 | 100.0 | 110.2 | 121.4 | 133.8 | 147.3 |
| EBIT, % | 19.25 | 15.28 | 13.5 | 13.8 | 16.55 | 15.67 | 15.67 | 15.67 | 15.67 | 15.67 |
| Total Cash | 53.9 | 52.8 | 94.6 | 136.5 | 153.7 | 124.7 | 137.4 | 151.3 | 166.7 | 183.7 |
| Total Cash, percent | .0 | .0 | .0 | .0 | .0 | .0 | .0 | .0 | .0 | .0 |
| Account Receivables | 96.3 | 103.5 | 109.4 | 108.6 | 115.4 | 141.5 | 155.9 | 171.8 | 189.2 | 208.5 |
| Account Receivables, % | 24.45 | 23.12 | 22.58 | 20.82 | 19.92 | 22.18 | 22.18 | 22.18 | 22.18 | 22.18 |
| Inventories | 8.1 | 7.9 | 10.2 | 11.8 | 10.0 | 12.7 | 13.9 | 15.4 | 16.9 | 18.6 |
| Inventories, % | 2.06 | 1.76 | 2.1 | 2.26 | 1.73 | 1.98 | 1.98 | 1.98 | 1.98 | 1.98 |
| Accounts Payable | 9.4 | 5.7 | 9.5 | 28.0 | 7.1 | 15.6 | 17.2 | 18.9 | 20.8 | 23.0 |
| Accounts Payable, % | 2.39 | 1.27 | 1.96 | 5.37 | 1.23 | 2.44 | 2.44 | 2.44 | 2.44 | 2.44 |
| Capital Expenditure | -15.4 | -16.8 | -20.7 | -23.0 | -19.2 | -25.1 | -27.6 | -30.5 | -33.5 | -37.0 |
| Capital Expenditure, % | -3.91 | -3.75 | -4.27 | -4.41 | -3.31 | -3.93 | -3.93 | -3.93 | -3.93 | -3.93 |
| Tax Rate, % | 26.99 | 26.99 | 26.99 | 26.99 | 26.99 | 26.99 | 26.99 | 26.99 | 26.99 | 26.99 |
| EBITAT | 64.9 | 54.6 | 49.7 | 54.0 | 70.0 | 77.9 | 85.8 | 94.5 | 104.1 | 114.7 |
| Depreciation | ||||||||||
| Changes in Account Receivables | ||||||||||
| Changes in Inventories | ||||||||||
| Changes in Accounts Payable | ||||||||||
| Capital Expenditure | ||||||||||
| UFCF | -22.6 | 54.2 | 51.8 | 80.0 | 58.7 | 69.9 | 85.3 | 94.0 | 103.5 | 114.0 |
| WACC, % | 6.26 | 6.25 | 6.25 | 6.24 | 6.24 | 6.25 | 6.25 | 6.25 | 6.25 | 6.25 |
| PV UFCF | ||||||||||
| SUM PV UFCF | 385.2 | |||||||||
| Long Term Growth Rate, % | 2.00 | |||||||||
| Free cash flow (T + 1) | 116 | |||||||||
| Terminal Value | 2,737 | |||||||||
| Present Terminal Value | 2,022 | |||||||||
| Enterprise Value | 2,407 | |||||||||
| Net Debt | -146 | |||||||||
| Equity Value | 2,553 | |||||||||
| Diluted Shares Outstanding, MM | 97 | |||||||||
| Equity Value Per Share | 2,632.11 |
Your Benefits
- Pre-Loaded Financial Model: Utilize Gamma Communications plc's (GAMAL) actual data for accurate DCF valuation.
- Comprehensive Forecast Control: Modify revenue growth, margins, WACC, and other essential parameters as needed.
- Real-Time Calculations: Automatic updates provide instant visibility into results as you adjust inputs.
- Professional-Grade Template: A polished Excel file crafted for high-quality valuation analysis.
- Flexible and Reusable: Designed for adaptability, allowing for ongoing use in detailed forecasting.
Key Features
- Comprehensive Historical Data: Access Gamma Communications plc’s (GAMAL) past financial statements along with pre-filled projections.
- Customizable Parameters: Adjust inputs such as WACC, tax rates, revenue growth, and EBITDA margins according to your analysis.
- Real-Time Valuation: Witness the recalibration of Gamma's intrinsic value as inputs are modified instantly.
- Visual Performance Insights: Intuitive dashboard charts present valuation outcomes and essential metrics at a glance.
- Designed for Precision: A robust tool tailored for analysts, investors, and financial professionals seeking accuracy.
How It Operates
- Download: Obtain the pre-configured Excel file featuring Gamma Communications plc’s (GAMAL) financial metrics.
- Customize: Tailor forecasts, such as revenue growth, EBITDA %, and WACC to suit your analysis.
- Automatic Updates: Intrinsic value and NPV calculations refresh in real-time as you make adjustments.
- Scenario Testing: Develop multiple projections and instantly evaluate different outcomes.
- Informed Decisions: Leverage the valuation results to inform your investment strategy with Gamma Communications plc (GAMAL).
Why Choose Gamma Communications plc (GAMAL)?
- Precision: Utilizes accurate financial data tailored for real-world applications.
- Adaptability: Allows users to easily adjust and experiment with various inputs.
- Efficiency: Eliminate the need to construct a financial model from the ground up.
- Expert-Level: Created with the insights and precision expected at the CFO level.
- Accessible: Intuitive design makes it simple for users without extensive financial modeling skills.
Who Can Benefit from Gamma Communications plc (GAMAL)?
- Investors: Gain insights and make informed decisions with our advanced valuation tool.
- Financial Analysts: Streamline your workflow with a customizable DCF model at your fingertips.
- Consultants: Effortlessly personalize the template for client presentations and detailed reports.
- Finance Enthusiasts: Enhance your knowledge of valuation practices with practical, real-world examples.
- Educators and Students: Utilize this tool as a hands-on resource for finance education and coursework.
Contents of the Template
- Preloaded GAMAL Data: Historical and forecasted financial metrics, encompassing revenue, EBIT, and capital expenditures.
- DCF and WACC Models: Advanced spreadsheets for determining intrinsic value and Weighted Average Cost of Capital.
- Editable Inputs: Yellow-highlighted cells that allow modifications to revenue growth, tax rates, and discount rates.
- Financial Statements: Detailed annual and quarterly financial reports for extensive analysis.
- Key Ratios: Metrics on profitability, leverage, and efficiency to assess company performance.
- Dashboard and Charts: Visual overviews of valuation results and underlying assumptions.
Disclaimer
All information, articles, and product details provided on this website are for general informational and educational purposes only. We do not claim any ownership over, nor do we intend to infringe upon, any trademarks, copyrights, logos, brand names, or other intellectual property mentioned or depicted on this site. Such intellectual property remains the property of its respective owners, and any references here are made solely for identification or informational purposes, without implying any affiliation, endorsement, or partnership.
We make no representations or warranties, express or implied, regarding the accuracy, completeness, or suitability of any content or products presented. Nothing on this website should be construed as legal, tax, investment, financial, medical, or other professional advice. In addition, no part of this site—including articles or product references—constitutes a solicitation, recommendation, endorsement, advertisement, or offer to buy or sell any securities, franchises, or other financial instruments, particularly in jurisdictions where such activity would be unlawful.
All content is of a general nature and may not address the specific circumstances of any individual or entity. It is not a substitute for professional advice or services. Any actions you take based on the information provided here are strictly at your own risk. You accept full responsibility for any decisions or outcomes arising from your use of this website and agree to release us from any liability in connection with your use of, or reliance upon, the content or products found herein.