
|
A Avaliação DCF da Great Eastern Shipping Company Limited (GESHIP.NS) |
Totalmente Editável: Adapte-Se Às Suas Necessidades No Excel Ou Planilhas
Design Profissional: Modelos Confiáveis E Padrão Da Indústria
Pré-Construídos Para Uso Rápido E Eficiente
Compatível com MAC/PC, totalmente desbloqueado
Não É Necessária Experiência; Fácil De Seguir
The Great Eastern Shipping Company Limited (GESHIP.NS) Bundle
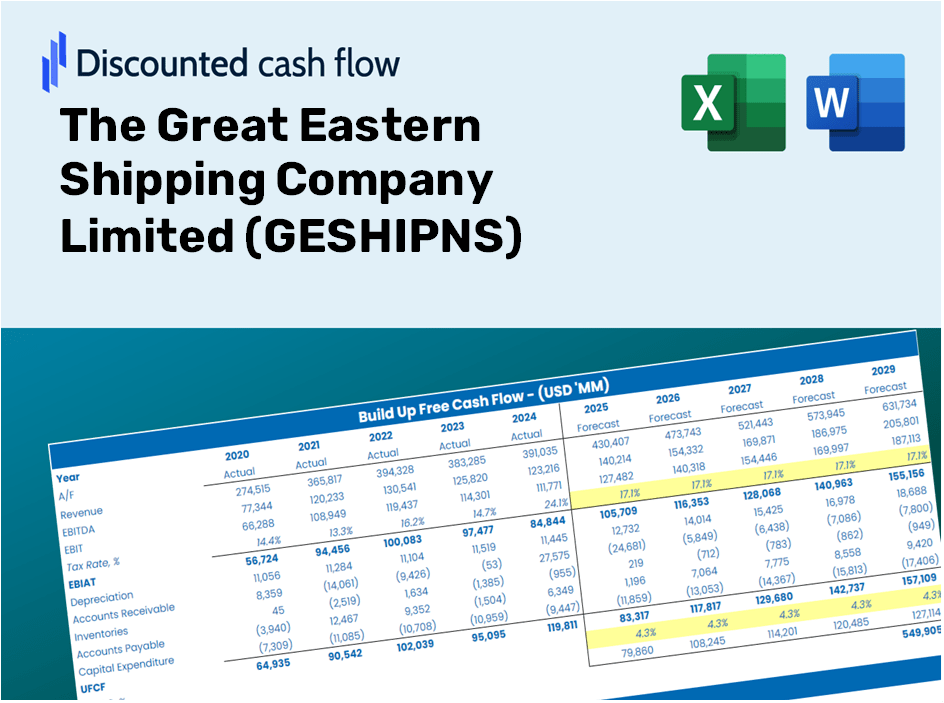
Atualize sua análise e aumente a precisão com a nossa calculadora DCF (GESHIPNS)! Equipado com dados reais da grande empresa de transporte oriental e suposições limitadas e personalizáveis, essa ferramenta o capacita a prever, analisar e valorizar (GESHIPNS) como um investidor especialista.
What You Will Receive
- Authentic GESHIPNS Data: Pre-filled financial metrics – from revenue to EBIT – grounded in actual and forecasted figures.
- Comprehensive Customization: Modify all essential variables (yellow cells) such as WACC, growth percentage, and tax rates.
- Immediate Valuation Adjustments: Automatic recalculations to assess how changes influence the fair value of GESHIPNS.
- Flexible Excel Template: Designed for quick modifications, scenario analysis, and thorough projections.
- Efficient and Precise: Avoid the hassle of building models from the ground up while ensuring accuracy and adaptability.
Key Features
- Pre-Loaded Data: Historical financial statements and pre-filled forecasts for The Great Eastern Shipping Company Limited (GESHIPNS).
- Fully Adjustable Inputs: Customize WACC, tax rates, revenue growth, and EBITDA margins according to your analysis.
- Instant Results: Watch the intrinsic value of The Great Eastern Shipping Company Limited (GESHIPNS) recalculate in real-time.
- Clear Visual Outputs: Dashboard charts illustrate valuation results and essential metrics clearly.
- Built for Accuracy: A professional-grade tool designed for analysts, investors, and finance professionals.
How It Works
- Step 1: Download the Excel file.
- Step 2: Examine the pre-filled financial data and projections for The Great Eastern Shipping Company Limited (GESHIPNS).
- Step 3: Adjust key inputs such as revenue growth, WACC, and tax rates (highlighted cells).
- Step 4: Observe the DCF model refresh in real-time as you modify your assumptions.
- Step 5: Evaluate the outputs and leverage the results for your investment strategies.
Reasons to Choose This Calculator for The Great Eastern Shipping Company Limited (GESHIPNS)
- Precise Information: Utilize accurate financial data from GESHIPNS for dependable valuation outcomes.
- Flexible Options: Tailor essential variables such as growth rates, WACC, and tax rates to align with your forecasts.
- Efficient: Built-in calculations save you the hassle of starting from the ground up.
- High-Quality Tool: Perfectly suited for investors, analysts, and consultants working with GESHIPNS.
- Easy to Use: A user-friendly interface and clear, step-by-step guidance make it accessible for everyone.
Who Should Utilize This Product?
- Investors: Accurately assess the fair value of The Great Eastern Shipping Company Limited (GESHIPNS) before making investment choices.
- CFOs: Utilize a high-quality DCF model for comprehensive financial reporting and analysis.
- Consultants: Seamlessly tailor the template for client valuation reports.
- Entrepreneurs: Acquire insights into the financial modeling practices of major shipping firms.
- Educators: Employ it as a pedagogical tool to illustrate valuation techniques.
Contents of the Template
- In-Depth DCF Model: A fully editable template featuring thorough valuation calculations.
- Real-World Financial Data: Historical and projected financials for The Great Eastern Shipping Company Limited (GESHIPNS) included for analysis.
- Flexible Parameters: Modify WACC, growth rates, and tax assumptions to explore various scenarios.
- Comprehensive Financial Statements: Detailed annual and quarterly breakdowns for enhanced insights.
- Essential Ratios: Integrated analysis of profitability, efficiency, and leverage metrics.
- Visual Dashboard: Charts and tables that present results in a clear and actionable format.
Disclaimer
All information, articles, and product details provided on this website are for general informational and educational purposes only. We do not claim any ownership over, nor do we intend to infringe upon, any trademarks, copyrights, logos, brand names, or other intellectual property mentioned or depicted on this site. Such intellectual property remains the property of its respective owners, and any references here are made solely for identification or informational purposes, without implying any affiliation, endorsement, or partnership.
We make no representations or warranties, express or implied, regarding the accuracy, completeness, or suitability of any content or products presented. Nothing on this website should be construed as legal, tax, investment, financial, medical, or other professional advice. In addition, no part of this site—including articles or product references—constitutes a solicitation, recommendation, endorsement, advertisement, or offer to buy or sell any securities, franchises, or other financial instruments, particularly in jurisdictions where such activity would be unlawful.
All content is of a general nature and may not address the specific circumstances of any individual or entity. It is not a substitute for professional advice or services. Any actions you take based on the information provided here are strictly at your own risk. You accept full responsibility for any decisions or outcomes arising from your use of this website and agree to release us from any liability in connection with your use of, or reliance upon, the content or products found herein.