
|
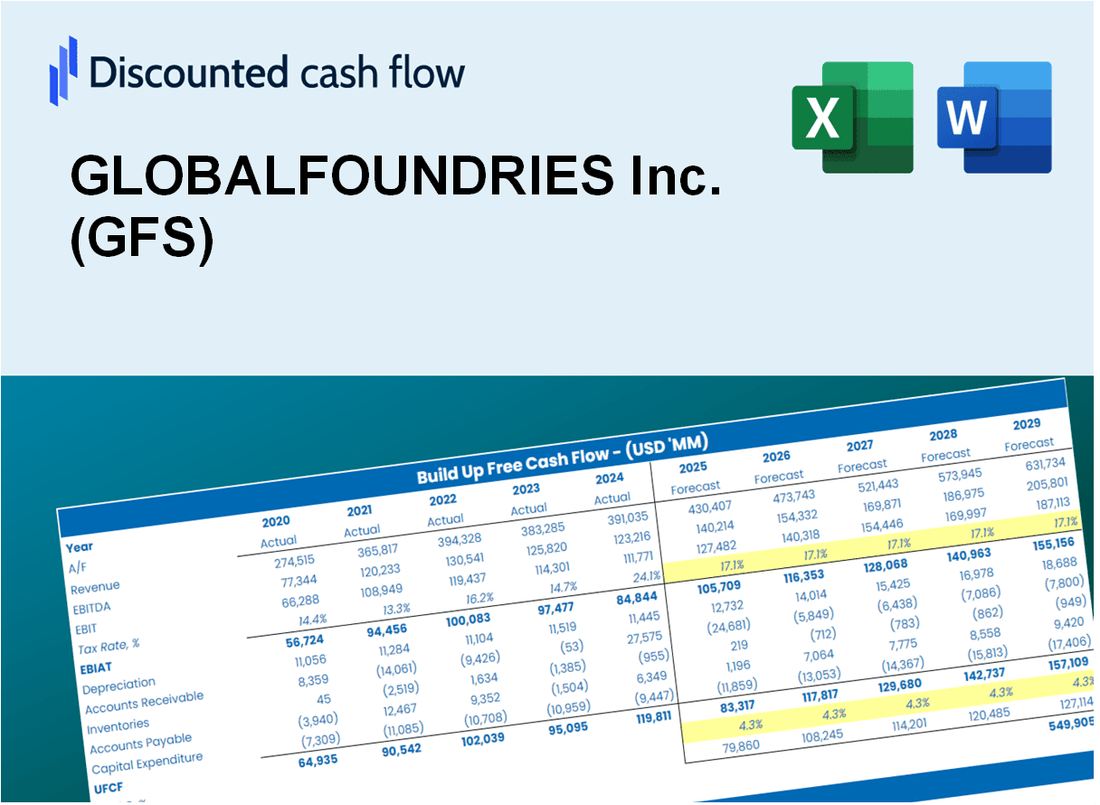
Avaliação GlobalFoundries Inc. (GFS) DCF |
Totalmente Editável: Adapte-Se Às Suas Necessidades No Excel Ou Planilhas
Design Profissional: Modelos Confiáveis E Padrão Da Indústria
Pré-Construídos Para Uso Rápido E Eficiente
Compatível com MAC/PC, totalmente desbloqueado
Não É Necessária Experiência; Fácil De Seguir
GLOBALFOUNDRIES Inc. (GFS) Bundle
Atualizar sua análise e aumentar a precisão com a nossa calculadora DCF (GFS)! Utilizando dados reais da GlobalFoundries Inc. e suposições personalizáveis, essa ferramenta capacita você a prever, avaliar e avaliar (GFS) como um investidor profissional experiente.
What You Will Receive
- Customizable Excel Template: A fully editable Excel-based DCF Calculator featuring pre-filled real GFS financials.
- Actual Market Data: Historical performance metrics and future projections (highlighted in the yellow cells).
- Flexible Forecasting: Adjust forecast parameters such as revenue growth, EBITDA %, and WACC at your convenience.
- Instant Calculations: Quickly observe how your inputs affect GLOBALFOUNDRIES' valuation.
- Professional Resource: Designed for investors, CFOs, consultants, and financial analysts.
- Intuitive Layout: Organized for simplicity and ease of navigation, complete with step-by-step guidance.
Key Features
- 🔍 Real-Life GFS Financials: Pre-filled historical and projected data for GLOBALFOUNDRIES Inc. (GFS).
- ✏️ Fully Customizable Inputs: Adjust all critical parameters (yellow cells) like WACC, growth %, and tax rates.
- 📊 Professional DCF Valuation: Built-in formulas calculate GLOBALFOUNDRIES’ intrinsic value using the Discounted Cash Flow method.
- ⚡ Instant Results: Visualize GLOBALFOUNDRIES’ valuation instantly after making changes.
- Scenario Analysis: Test and compare outcomes for various financial assumptions side-by-side.
How It Works
- Step 1: Download the prebuilt Excel template featuring GLOBALFOUNDRIES Inc. (GFS) data.
- Step 2: Review the pre-filled sheets to familiarize yourself with the essential metrics.
- Step 3: Modify forecasts and assumptions in the editable yellow cells (WACC, growth, margins).
- Step 4: Instantly see the recalculated results, including GLOBALFOUNDRIES Inc.'s (GFS) intrinsic value.
- Step 5: Utilize the outputs to make informed investment decisions or generate detailed reports.
Why Choose This Calculator for GLOBALFOUNDRIES Inc. (GFS)?
- Accuracy: Utilizes real GLOBALFOUNDRIES financials to ensure precise data.
- Flexibility: Built for users to easily test and adjust inputs as needed.
- Time-Saving: Eliminate the need to construct a DCF model from the ground up.
- Professional-Grade: Crafted with the precision and usability expected at the CFO level.
- User-Friendly: Simple to navigate, even for individuals without extensive financial modeling expertise.
Who Should Use This Product?
- Individual Investors: Make informed decisions about buying or selling GLOBALFOUNDRIES Inc. (GFS) stock.
- Financial Analysts: Streamline valuation processes with ready-to-use financial models for GLOBALFOUNDRIES Inc. (GFS).
- Consultants: Deliver professional valuation insights on GLOBALFOUNDRIES Inc. (GFS) to clients quickly and accurately.
- Business Owners: Understand how semiconductor companies like GLOBALFOUNDRIES Inc. (GFS) are valued to guide your own strategy.
- Finance Students: Learn valuation techniques using real-world data and scenarios related to GLOBALFOUNDRIES Inc. (GFS).
What the Template Contains
- Preloaded GFS Data: Historical and projected financial data, including revenue, EBIT, and capital expenditures.
- DCF and WACC Models: Professional-grade sheets for calculating intrinsic value and Weighted Average Cost of Capital.
- Editable Inputs: Yellow-highlighted cells for adjusting revenue growth, tax rates, and discount rates.
- Financial Statements: Comprehensive annual and quarterly financials for deeper analysis.
- Key Ratios: Profitability, leverage, and efficiency ratios to evaluate performance.
- Dashboard and Charts: Visual summaries of valuation outcomes and assumptions.
Disclaimer
All information, articles, and product details provided on this website are for general informational and educational purposes only. We do not claim any ownership over, nor do we intend to infringe upon, any trademarks, copyrights, logos, brand names, or other intellectual property mentioned or depicted on this site. Such intellectual property remains the property of its respective owners, and any references here are made solely for identification or informational purposes, without implying any affiliation, endorsement, or partnership.
We make no representations or warranties, express or implied, regarding the accuracy, completeness, or suitability of any content or products presented. Nothing on this website should be construed as legal, tax, investment, financial, medical, or other professional advice. In addition, no part of this site—including articles or product references—constitutes a solicitation, recommendation, endorsement, advertisement, or offer to buy or sell any securities, franchises, or other financial instruments, particularly in jurisdictions where such activity would be unlawful.
All content is of a general nature and may not address the specific circumstances of any individual or entity. It is not a substitute for professional advice or services. Any actions you take based on the information provided here are strictly at your own risk. You accept full responsibility for any decisions or outcomes arising from your use of this website and agree to release us from any liability in connection with your use of, or reliance upon, the content or products found herein.