
|
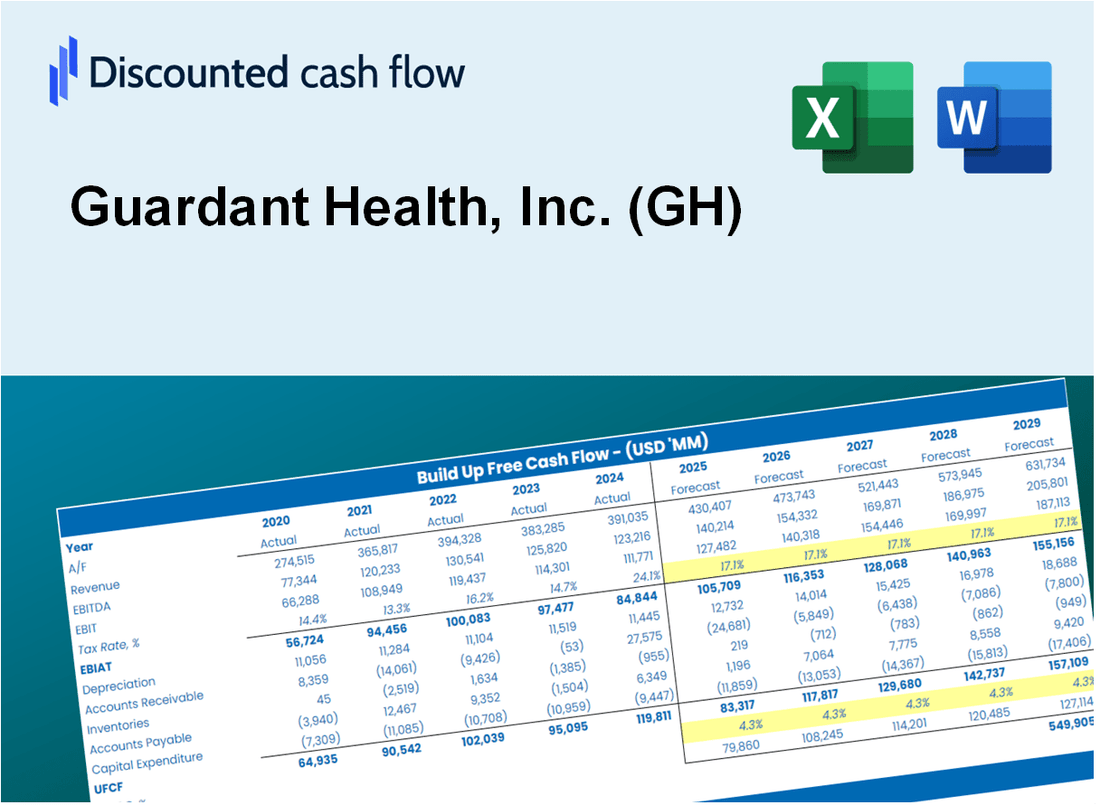
Avaliação DCF da Guardant Health, Inc. (GH) |
Totalmente Editável: Adapte-Se Às Suas Necessidades No Excel Ou Planilhas
Design Profissional: Modelos Confiáveis E Padrão Da Indústria
Pré-Construídos Para Uso Rápido E Eficiente
Compatível com MAC/PC, totalmente desbloqueado
Não É Necessária Experiência; Fácil De Seguir
Guardant Health, Inc. (GH) Bundle
Avalie a Guardant Health, Inc. (GH) Perspectivas financeiras como um especialista! Esta calculadora (GH) DCF fornece dados financeiros pré-preenchidos, juntamente com a flexibilidade para modificar o crescimento da receita, o WACC, as margens e outras suposições essenciais para se alinhar às suas projeções.
Discounted Cash Flow (DCF) - (USD MM)
| Year | AY1 2020 |
AY2 2021 |
AY3 2022 |
AY4 2023 |
AY5 2024 |
FY1 2025 |
FY2 2026 |
FY3 2027 |
FY4 2028 |
FY5 2029 |
|---|---|---|---|---|---|---|---|---|---|---|
| Revenue | 286.7 | 373.7 | 449.5 | 563.9 | 739.0 | 936.9 | 1,187.8 | 1,505.9 | 1,909.2 | 2,420.5 |
| Revenue Growth, % | 0 | 30.32 | 20.31 | 25.45 | 31.04 | 26.78 | 26.78 | 26.78 | 26.78 | 26.78 |
| EBITDA | -225.1 | -359.6 | -614.9 | -433.3 | -390.1 | -757.7 | -960.6 | -1,217.9 | -1,544.0 | -1,957.5 |
| EBITDA, % | -78.5 | -96.24 | -136.79 | -76.83 | -52.79 | -80.87 | -80.87 | -80.87 | -80.87 | -80.87 |
| Depreciation | 16.1 | 22.3 | 36.0 | 42.9 | 42.4 | 61.7 | 78.2 | 99.1 | 125.6 | 159.3 |
| Depreciation, % | 5.6 | 5.96 | 8 | 7.6 | 5.74 | 6.58 | 6.58 | 6.58 | 6.58 | 6.58 |
| EBIT | -241.1 | -381.9 | -650.9 | -476.2 | -432.5 | -800.2 | -1,014.5 | -1,286.2 | -1,630.7 | -2,067.4 |
| EBIT, % | -84.1 | -102.21 | -144.79 | -84.44 | -58.52 | -85.41 | -85.41 | -85.41 | -85.41 | -85.41 |
| Total Cash | 1,794.9 | 932.7 | 1,011.2 | 1,168.6 | 840.0 | 936.9 | 1,187.8 | 1,505.9 | 1,909.2 | 2,420.5 |
| Total Cash, percent | .0 | .0 | .0 | .0 | .0 | .0 | .0 | .0 | .0 | .0 |
| Account Receivables | 53.3 | 97.7 | 97.3 | 88.8 | 110.3 | 181.8 | 230.5 | 292.2 | 370.5 | 469.7 |
| Account Receivables, % | 18.59 | 26.13 | 21.63 | 15.74 | 14.92 | 19.4 | 19.4 | 19.4 | 19.4 | 19.4 |
| Inventories | 22.7 | 30.7 | 51.6 | 61.9 | 71.1 | 90.3 | 114.5 | 145.2 | 184.1 | 233.4 |
| Inventories, % | 7.92 | 8.21 | 11.48 | 10.98 | 9.62 | 9.64 | 9.64 | 9.64 | 9.64 | 9.64 |
| Accounts Payable | 7.3 | 38.5 | 68.9 | 51.7 | 38.6 | 79.8 | 101.2 | 128.3 | 162.6 | 206.2 |
| Accounts Payable, % | 2.56 | 10.31 | 15.33 | 9.17 | 5.22 | 8.52 | 8.52 | 8.52 | 8.52 | 8.52 |
| Capital Expenditure | -54.1 | -75.0 | -77.5 | -20.5 | -35.1 | -120.9 | -153.3 | -194.4 | -246.5 | -312.5 |
| Capital Expenditure, % | -18.85 | -20.08 | -17.23 | -3.63 | -4.75 | -12.91 | -12.91 | -12.91 | -12.91 | -12.91 |
| Tax Rate, % | -0.29511 | -0.29511 | -0.29511 | -0.29511 | -0.29511 | -0.29511 | -0.29511 | -0.29511 | -0.29511 | -0.29511 |
| EBITAT | -248.9 | -403.0 | -652.0 | -476.9 | -433.8 | -800.2 | -1,014.5 | -1,286.2 | -1,630.7 | -2,067.4 |
| Depreciation | ||||||||||
| Changes in Account Receivables | ||||||||||
| Changes in Inventories | ||||||||||
| Changes in Accounts Payable | ||||||||||
| Capital Expenditure | ||||||||||
| UFCF | -355.5 | -476.8 | -683.6 | -473.5 | -470.3 | -909.1 | -1,141.2 | -1,446.8 | -1,834.3 | -2,325.5 |
| WACC, % | 10.51 | 10.51 | 10.51 | 10.51 | 10.51 | 10.51 | 10.51 | 10.51 | 10.51 | 10.51 |
| PV UFCF | ||||||||||
| SUM PV UFCF | -5,469.9 | |||||||||
| Long Term Growth Rate, % | 2.00 | |||||||||
| Free cash flow (T + 1) | -2,372 | |||||||||
| Terminal Value | -27,870 | |||||||||
| Present Terminal Value | -16,909 | |||||||||
| Enterprise Value | -22,379 | |||||||||
| Net Debt | 811 | |||||||||
| Equity Value | -23,189 | |||||||||
| Diluted Shares Outstanding, MM | 123 | |||||||||
| Equity Value Per Share | -188.92 |
What You Will Get
- Real GH Financial Data: Pre-filled with Guardant Health’s historical and projected data for precise analysis.
- Fully Editable Template: Modify key inputs like revenue growth, WACC, and EBITDA % with ease.
- Automatic Calculations: See Guardant Health’s intrinsic value update instantly based on your changes.
- Professional Valuation Tool: Designed for investors, analysts, and consultants seeking accurate DCF results.
- User-Friendly Design: Simple structure and clear instructions for all experience levels.
Key Features
- Real-Life GH Data: Pre-filled with Guardant Health’s historical financials and forward-looking projections.
- Fully Customizable Inputs: Adjust revenue growth, margins, WACC, tax rates, and capital expenditures.
- Dynamic Valuation Model: Automatic updates to Net Present Value (NPV) and intrinsic value based on your inputs.
- Scenario Testing: Create multiple forecast scenarios to analyze different valuation outcomes.
- User-Friendly Design: Simple, structured, and designed for professionals and beginners alike.
How It Works
- Step 1: Download the prebuilt Excel template with Guardant Health’s (GH) data included.
- Step 2: Explore the pre-filled sheets and understand the key metrics relevant to Guardant Health (GH).
- Step 3: Update forecasts and assumptions in the editable yellow cells (WACC, growth, margins).
- Step 4: Instantly view recalculated results, including Guardant Health’s (GH) intrinsic value.
- Step 5: Make informed investment decisions or generate reports using the outputs.
Why Choose This Calculator?
- Designed for Experts: A sophisticated tool utilized by analysts, CFOs, and healthcare consultants.
- Accurate Data: Guardant Health's historical and projected financials preloaded for precision.
- Flexible Scenario Analysis: Effortlessly simulate various forecasts and assumptions.
- Insightful Outputs: Automatically computes intrinsic value, NPV, and essential metrics.
- User-Friendly: Step-by-step guidance ensures a smooth experience.
Who Should Use This Product?
- Healthcare Investors: Develop comprehensive valuation models for in-depth analysis of Guardant Health (GH) stock.
- Corporate Strategy Teams: Evaluate valuation scenarios to inform strategic decisions within the organization.
- Consultants and Advisors: Offer clients precise valuation insights for Guardant Health (GH) and its market position.
- Students and Educators: Utilize real-world data to enhance learning and practice in financial modeling.
- Biotech Enthusiasts: Gain insights into how biotech companies like Guardant Health (GH) are valued in the financial landscape.
What the Template Contains
- Historical Data: Includes Guardant Health's past financials and baseline forecasts.
- DCF and Levered DCF Models: Detailed templates to calculate Guardant Health's intrinsic value.
- WACC Sheet: Pre-built calculations for Weighted Average Cost of Capital.
- Editable Inputs: Modify key drivers like growth rates, EBITDA %, and CAPEX assumptions.
- Quarterly and Annual Statements: A complete breakdown of Guardant Health's financials.
- Interactive Dashboard: Visualize valuation results and projections dynamically.
Disclaimer
All information, articles, and product details provided on this website are for general informational and educational purposes only. We do not claim any ownership over, nor do we intend to infringe upon, any trademarks, copyrights, logos, brand names, or other intellectual property mentioned or depicted on this site. Such intellectual property remains the property of its respective owners, and any references here are made solely for identification or informational purposes, without implying any affiliation, endorsement, or partnership.
We make no representations or warranties, express or implied, regarding the accuracy, completeness, or suitability of any content or products presented. Nothing on this website should be construed as legal, tax, investment, financial, medical, or other professional advice. In addition, no part of this site—including articles or product references—constitutes a solicitation, recommendation, endorsement, advertisement, or offer to buy or sell any securities, franchises, or other financial instruments, particularly in jurisdictions where such activity would be unlawful.
All content is of a general nature and may not address the specific circumstances of any individual or entity. It is not a substitute for professional advice or services. Any actions you take based on the information provided here are strictly at your own risk. You accept full responsibility for any decisions or outcomes arising from your use of this website and agree to release us from any liability in connection with your use of, or reliance upon, the content or products found herein.