
|
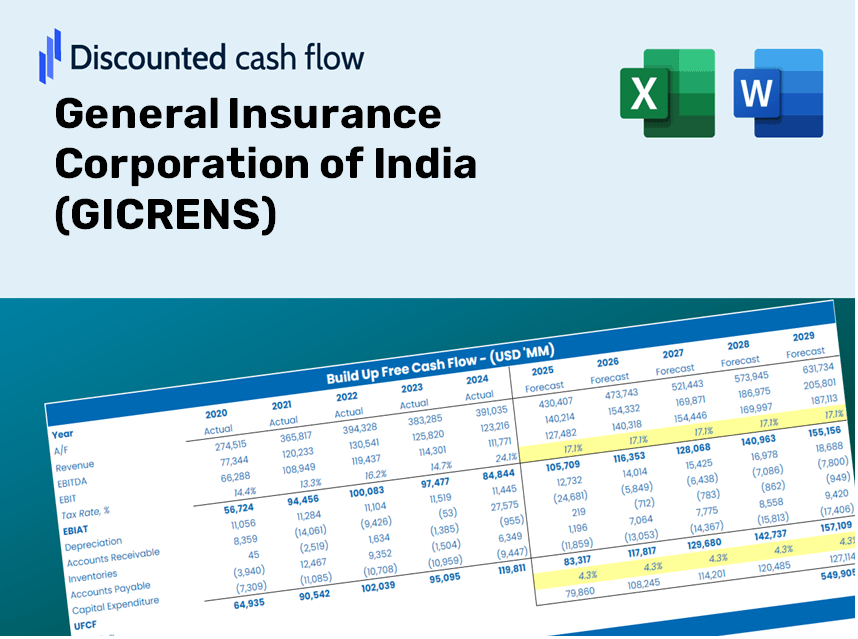
Avaliação DCF da Corporação Geral de Seguro da Índia (Gicre.NS) |
Totalmente Editável: Adapte-Se Às Suas Necessidades No Excel Ou Planilhas
Design Profissional: Modelos Confiáveis E Padrão Da Indústria
Pré-Construídos Para Uso Rápido E Eficiente
Compatível com MAC/PC, totalmente desbloqueado
Não É Necessária Experiência; Fácil De Seguir
General Insurance Corporation of India (GICRE.NS) Bundle
Avalie a perspectiva financeira da General Insurance Corporation of India (Gicrens) com precisão especializada! Essa calculadora DCF (Gicrens) fornece dados financeiros pré-preenchidos, juntamente com a flexibilidade para modificar o crescimento da receita, o WACC, as margens e outras suposições cruciais para se alinhar com suas projeções.
Discounted Cash Flow (DCF) - (USD MM)
| Year | AY1 2021 |
AY2 2022 |
AY3 2023 |
AY4 2024 |
AY5 2025 |
FY1 2026 |
FY2 2027 |
FY3 2028 |
FY4 2029 |
FY5 2030 |
|---|---|---|---|---|---|---|---|---|---|---|
| Revenue | 489,075.0 | 514,872.5 | 483,421.9 | 465,495.6 | 507,023.4 | 512,574.5 | 518,186.3 | 523,859.6 | 529,594.9 | 535,393.1 |
| Revenue Growth, % | 0 | 5.27 | -6.11 | -3.71 | 8.92 | 1.09 | 1.09 | 1.09 | 1.09 | 1.09 |
| EBITDA | 31,473.9 | 38,311.5 | 81,216.2 | 80,205.8 | 91,899.9 | 67,692.8 | 68,434.0 | 69,183.2 | 69,940.6 | 70,706.4 |
| EBITDA, % | 6.44 | 7.44 | 16.8 | 17.23 | 18.13 | 13.21 | 13.21 | 13.21 | 13.21 | 13.21 |
| Depreciation | 149.5 | 137.5 | 96.9 | 118.6 | 145.6 | 134.8 | 136.3 | 137.8 | 139.3 | 140.8 |
| Depreciation, % | 0.03057077 | 0.02670195 | 0.02004729 | 0.02547822 | 0.02871662 | 0.02630297 | 0.02630297 | 0.02630297 | 0.02630297 | 0.02630297 |
| EBIT | 31,324.4 | 38,174.0 | 81,119.3 | 80,087.2 | 91,754.3 | 67,558.0 | 68,297.7 | 69,045.4 | 69,801.3 | 70,565.5 |
| EBIT, % | 6.4 | 7.41 | 16.78 | 17.2 | 18.1 | 13.18 | 13.18 | 13.18 | 13.18 | 13.18 |
| Total Cash | 199,981.1 | 219,514.2 | 245,749.7 | 248,551.8 | 252,796.4 | 243,589.5 | 246,256.4 | 248,952.5 | 251,678.1 | 254,433.6 |
| Total Cash, percent | .0 | .0 | .0 | .0 | .0 | .0 | .0 | .0 | .0 | .0 |
| Account Receivables | .0 | 145,498.5 | 121,457.9 | 111,150.7 | 129,055.9 | 105,298.5 | 106,451.3 | 107,616.8 | 108,795.0 | 109,986.1 |
| Account Receivables, % | 0 | 28.26 | 25.12 | 23.88 | 25.45 | 20.54 | 20.54 | 20.54 | 20.54 | 20.54 |
| Inventories | .0 | .0 | .0 | .0 | .0 | .0 | .0 | .0 | .0 | .0 |
| Inventories, % | 0 | 0 | 0 | 0 | 0 | 0 | 0 | 0 | 0 | 0 |
| Accounts Payable | 33,293.1 | 40,528.7 | 43,774.9 | 46,378.8 | 44,161.0 | 43,473.8 | 43,949.8 | 44,431.0 | 44,917.4 | 45,409.2 |
| Accounts Payable, % | 6.81 | 7.87 | 9.06 | 9.96 | 8.71 | 8.48 | 8.48 | 8.48 | 8.48 | 8.48 |
| Capital Expenditure | -60.3 | -154.5 | -1,340.7 | -56.8 | -254.1 | -391.6 | -395.9 | -400.2 | -404.6 | -409.0 |
| Capital Expenditure, % | -0.01232183 | -0.03001384 | -0.27733 | -0.01220506 | -0.05011603 | -0.07639682 | -0.07639682 | -0.07639682 | -0.07639682 | -0.07639682 |
| Tax Rate, % | 18.37 | 18.37 | 18.37 | 18.37 | 18.37 | 18.37 | 18.37 | 18.37 | 18.37 | 18.37 |
| EBITAT | 20,325.5 | 24,261.6 | 69,767.6 | 67,565.4 | 74,896.3 | 51,403.6 | 51,966.3 | 52,535.3 | 53,110.5 | 53,691.9 |
| Depreciation | ||||||||||
| Changes in Account Receivables | ||||||||||
| Changes in Inventories | ||||||||||
| Changes in Accounts Payable | ||||||||||
| Capital Expenditure | ||||||||||
| UFCF | 53,707.8 | -114,018.4 | 95,810.6 | 80,538.2 | 54,664.8 | 74,217.0 | 51,029.9 | 51,588.6 | 52,153.4 | 52,724.4 |
| WACC, % | 5.58 | 5.58 | 5.58 | 5.58 | 5.58 | 5.58 | 5.58 | 5.58 | 5.58 | 5.58 |
| PV UFCF | ||||||||||
| SUM PV UFCF | 242,091.7 | |||||||||
| Long Term Growth Rate, % | 2.00 | |||||||||
| Free cash flow (T + 1) | 53,779 | |||||||||
| Terminal Value | 1,503,850 | |||||||||
| Present Terminal Value | 1,146,507 | |||||||||
| Enterprise Value | 1,388,599 | |||||||||
| Net Debt | -252,796 | |||||||||
| Equity Value | 1,641,395 | |||||||||
| Diluted Shares Outstanding, MM | 1,754 | |||||||||
| Equity Value Per Share | 935.56 |
What You Will Receive
- Pre-Filled Financial Model: GICRENS's actual data provides accurate DCF valuation.
- Comprehensive Forecast Control: Modify revenue growth, margins, WACC, and other essential factors.
- Real-Time Calculations: Automatic updates let you see results instantly as you adjust parameters.
- Investor-Ready Template: A polished Excel file crafted for high-quality valuation.
- Customizable and Reusable: Designed for versatility, enabling repeated use for in-depth forecasts.
Key Features
- Pre-Loaded Data: GICRENS’s historical financial records and pre-filled forecasts.
- Fully Adjustable Inputs: Customize inputs for WACC, tax rates, premium growth, and underwriting margins.
- Instant Results: Watch GICRENS’s intrinsic value update in real time.
- Clear Visual Outputs: Dashboard charts illustrate valuation outcomes and essential metrics.
- Built for Accuracy: A professional tool tailored for analysts, investors, and finance professionals.
How It Functions
- 1. Access the Template: Download and open the Excel file featuring General Insurance Corporation of India’s (GICRENS) preloaded data.
- 2. Adjust Assumptions: Modify key parameters such as growth rates, WACC, and capital expenditures.
- 3. View Results in Real-Time: The DCF model automatically computes intrinsic value and NPV.
- 4. Explore Various Scenarios: Analyze different valuation outcomes by comparing multiple forecasts.
- 5. Present with Assurance: Deliver professional valuation insights to inform your decision-making.
Why Opt for GICRENS Calculator?
- Precision: Authentic GICRENS financial data ensures reliability.
- Customizable: Built to allow users to freely adjust and experiment with inputs.
- Efficiency: Avoid the complexity of creating a financial model from the ground up.
- Industry-Standard: Crafted with the accuracy and functionality expected at the CFO level.
- Intuitive: User-friendly interface designed for everyone, regardless of financial modeling expertise.
Who Should Benefit from GICRENS Products?
- Insurance Professionals: Develop comprehensive and dependable risk assessment models for client portfolios.
- Corporate Risk Management Teams: Evaluate risk scenarios to inform strategic planning.
- Financial Advisors and Consultants: Equip clients with precise insights on insurance valuations related to GICRENS (GICRENS).
- Students and Academic Instructors: Utilize real-life data to enhance learning and practice in risk management and insurance finance.
- Industry Enthusiasts: Gain insights into how companies in the insurance sector, such as GICRENS (GICRENS), are valued in the marketplace.
Contents of the Template
- Preloaded GICRENS Data: Historical and forecasted financial metrics, including premium income, claims ratio, and operating expenses.
- DCF and WACC Models: Advanced sheets designed to compute intrinsic value and Weighted Average Cost of Capital.
- Editable Inputs: Yellow-highlighted cells for modifying premium growth, tax rates, and discount rates.
- Financial Statements: Detailed annual and quarterly financial reports for in-depth analysis.
- Key Ratios: Metrics for assessing profitability, solvency, and operational efficiency.
- Dashboard and Charts: Visual representations of valuation results and underlying assumptions.
Disclaimer
All information, articles, and product details provided on this website are for general informational and educational purposes only. We do not claim any ownership over, nor do we intend to infringe upon, any trademarks, copyrights, logos, brand names, or other intellectual property mentioned or depicted on this site. Such intellectual property remains the property of its respective owners, and any references here are made solely for identification or informational purposes, without implying any affiliation, endorsement, or partnership.
We make no representations or warranties, express or implied, regarding the accuracy, completeness, or suitability of any content or products presented. Nothing on this website should be construed as legal, tax, investment, financial, medical, or other professional advice. In addition, no part of this site—including articles or product references—constitutes a solicitation, recommendation, endorsement, advertisement, or offer to buy or sell any securities, franchises, or other financial instruments, particularly in jurisdictions where such activity would be unlawful.
All content is of a general nature and may not address the specific circumstances of any individual or entity. It is not a substitute for professional advice or services. Any actions you take based on the information provided here are strictly at your own risk. You accept full responsibility for any decisions or outcomes arising from your use of this website and agree to release us from any liability in connection with your use of, or reliance upon, the content or products found herein.