
|
Avaliação DCF Golar LNG Limited Limited (GLNG) |
Totalmente Editável: Adapte-Se Às Suas Necessidades No Excel Ou Planilhas
Design Profissional: Modelos Confiáveis E Padrão Da Indústria
Pré-Construídos Para Uso Rápido E Eficiente
Compatível com MAC/PC, totalmente desbloqueado
Não É Necessária Experiência; Fácil De Seguir
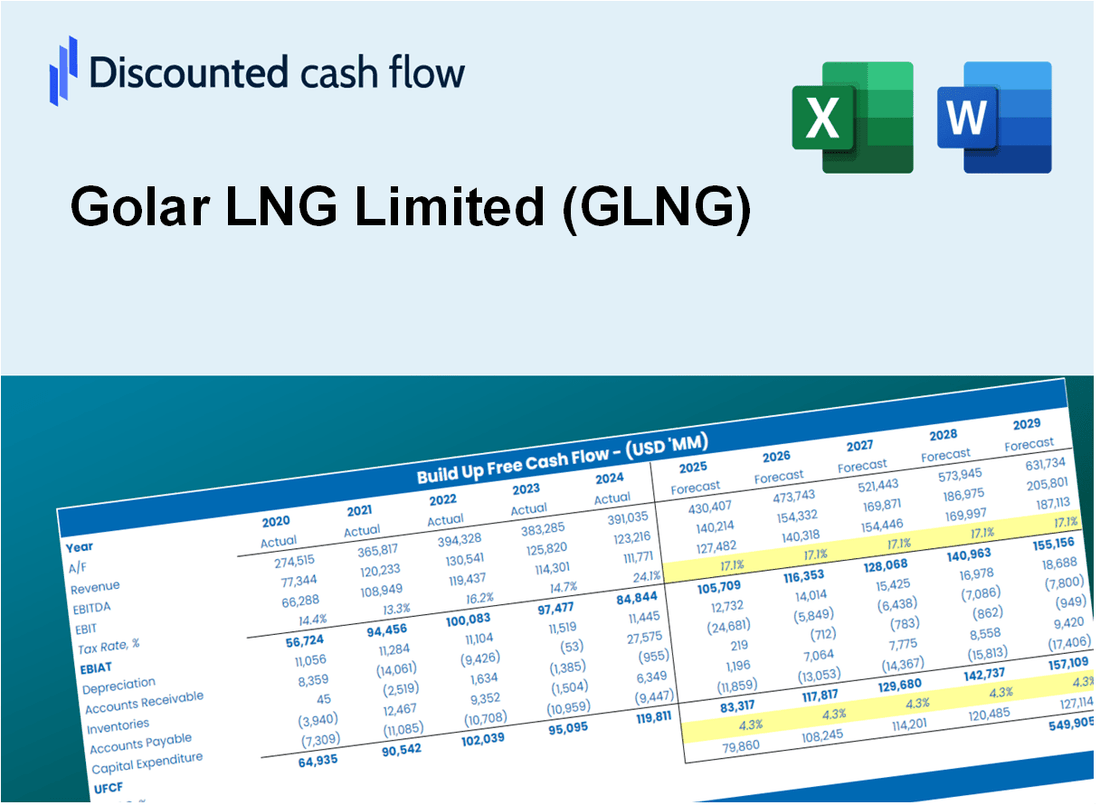
Golar LNG Limited (GLNG) Bundle
Simplifique a avaliação Golar LNG Limited (GLNG) com esta calculadora DCF personalizável! Com o Real Golar LNG Limited (GLNG) financeiras e insumos de previsão ajustáveis, você pode testar cenários e descobrir o valor justo da Golar LNG LNG LIMITED (GLNG) em minutos.
Discounted Cash Flow (DCF) - (USD MM)
| Year | AY1 2020 |
AY2 2021 |
AY3 2022 |
AY4 2023 |
AY5 2024 |
FY1 2025 |
FY2 2026 |
FY3 2027 |
FY4 2028 |
FY5 2029 |
|---|---|---|---|---|---|---|---|---|---|---|
| Revenue | 438.6 | 260.3 | 267.7 | 298.4 | 260.4 | 234.9 | 212.0 | 191.3 | 172.6 | 155.7 |
| Revenue Growth, % | 0 | -40.66 | 2.87 | 11.46 | -12.75 | -9.77 | -9.77 | -9.77 | -9.77 | -9.77 |
| EBITDA | 193.1 | 29.5 | 1,077.1 | 53.2 | 147.0 | 107.9 | 97.4 | 87.8 | 79.3 | 71.5 |
| EBITDA, % | 44.02 | 11.35 | 402.31 | 17.83 | 56.44 | 45.93 | 45.93 | 45.93 | 45.93 | 45.93 |
| Depreciation | 107.9 | 55.4 | 51.7 | 50.3 | 53.5 | 48.2 | 43.5 | 39.2 | 35.4 | 32.0 |
| Depreciation, % | 24.6 | 21.27 | 19.31 | 16.85 | 20.56 | 20.52 | 20.52 | 20.52 | 20.52 | 20.52 |
| EBIT | 85.1 | -25.8 | 1,025.4 | 2.9 | 93.4 | 68.8 | 62.0 | 56.0 | 50.5 | 45.6 |
| EBIT, % | 19.41 | -9.92 | 382.99 | 0.97645 | 35.88 | 29.27 | 29.27 | 29.27 | 29.27 | 29.27 |
| Total Cash | 127.7 | 716.1 | 1,103.6 | 679.2 | 566.4 | 201.6 | 181.9 | 164.1 | 148.1 | 133.6 |
| Total Cash, percent | .0 | .0 | .0 | .0 | .0 | .0 | .0 | .0 | .0 | .0 |
| Account Receivables | 38.1 | 35.0 | 56.1 | 63.2 | 92.5 | 46.9 | 42.3 | 38.2 | 34.4 | 31.1 |
| Account Receivables, % | 8.67 | 13.43 | 20.96 | 21.17 | 35.51 | 19.95 | 19.95 | 19.95 | 19.95 | 19.95 |
| Inventories | 1.5 | .5 | .7 | 2.0 | 2.1 | 1.1 | 1.0 | .9 | .8 | .7 |
| Inventories, % | 0.34949 | 0.20594 | 0.25846 | 0.66683 | 0.7977 | 0.45568 | 0.45568 | 0.45568 | 0.45568 | 0.45568 |
| Accounts Payable | 10.6 | 4.9 | 9.0 | 7.5 | 198.9 | 40.7 | 36.7 | 33.1 | 29.9 | 27.0 |
| Accounts Payable, % | 2.41 | 1.89 | 3.36 | 2.5 | 76.39 | 17.31 | 17.31 | 17.31 | 17.31 | 17.31 |
| Capital Expenditure | -302.2 | -214.4 | -267.4 | -325.2 | -438.5 | -212.0 | -191.3 | -172.6 | -155.7 | -140.5 |
| Capital Expenditure, % | -68.89 | -82.38 | -99.88 | -108.98 | -168.43 | -90.23 | -90.23 | -90.23 | -90.23 | -90.23 |
| Tax Rate, % | 37.06 | 37.06 | 37.06 | 37.06 | 37.06 | 37.06 | 37.06 | 37.06 | 37.06 | 37.06 |
| EBITAT | -2,576.6 | -65.7 | 681.5 | 107.2 | 58.8 | 45.3 | 40.9 | 36.9 | 33.3 | 30.0 |
| Depreciation | ||||||||||
| Changes in Account Receivables | ||||||||||
| Changes in Inventories | ||||||||||
| Changes in Accounts Payable | ||||||||||
| Capital Expenditure | ||||||||||
| UFCF | -2,799.9 | -226.3 | 448.5 | -177.6 | -164.1 | -230.1 | -106.2 | -95.8 | -86.4 | -78.0 |
| WACC, % | 3.44 | 4.43 | 4.1 | 4.43 | 4.07 | 4.09 | 4.09 | 4.09 | 4.09 | 4.09 |
| PV UFCF | ||||||||||
| SUM PV UFCF | -541.4 | |||||||||
| Long Term Growth Rate, % | 2.00 | |||||||||
| Free cash flow (T + 1) | -80 | |||||||||
| Terminal Value | -3,798 | |||||||||
| Present Terminal Value | -3,107 | |||||||||
| Enterprise Value | -3,649 | |||||||||
| Net Debt | 893 | |||||||||
| Equity Value | -4,541 | |||||||||
| Diluted Shares Outstanding, MM | 105 | |||||||||
| Equity Value Per Share | -43.14 |
What You Will Get
- Editable Forecast Inputs: Easily modify assumptions (growth %, margins, WACC) to create various scenarios.
- Real-World Data: Golar LNG Limited’s financial data pre-filled to kickstart your analysis.
- Automatic DCF Outputs: The template computes Net Present Value (NPV) and intrinsic value for you.
- Customizable and Professional: A refined Excel model that adjusts to your valuation requirements.
- Built for Analysts and Investors: Perfect for testing projections, validating strategies, and enhancing efficiency.
Key Features
- Customizable Financial Metrics: Adjust essential inputs such as revenue growth, EBITDA margin, and capital expenditures.
- Instant DCF Valuation: Quickly computes intrinsic value, NPV, and other financial outputs.
- High-Precision Accuracy: Leverages Golar LNG Limited’s (GLNG) actual financial data for dependable valuation results.
- Effortless Scenario Analysis: Easily evaluate different assumptions and analyze results side by side.
- Efficiency Booster: Remove the hassle of constructing intricate valuation models from the ground up.
How It Works
- Step 1: Download the prebuilt Excel template featuring Golar LNG Limited’s (GLNG) data.
- Step 2: Navigate through the pre-filled sheets to familiarize yourself with the key metrics.
- Step 3: Modify forecasts and assumptions in the editable yellow cells (WACC, growth, margins).
- Step 4: Instantly view the updated results, including Golar LNG Limited’s (GLNG) intrinsic value.
- Step 5: Make informed investment choices or create reports based on the outputs.
Why Choose Golar LNG Limited (GLNG) Calculator?
- Accuracy: Utilizes Golar LNG Limited's real financial data for precise calculations.
- Flexibility: Users can easily adjust and experiment with input variables.
- Time-Saving: Avoid the complexities of constructing a DCF model from the ground up.
- Professional-Grade: Crafted with the expertise and usability expected at the CFO level.
- User-Friendly: Intuitive interface suitable for users without extensive financial modeling skills.
Who Should Use Golar LNG Limited (GLNG)?
- Investors: Make informed choices with a reliable resource for LNG market insights.
- Financial Analysts: Streamline your analysis with comprehensive data on Golar LNG's performance.
- Consultants: Efficiently tailor presentations or reports using Golar LNG's industry benchmarks.
- Energy Sector Enthusiasts: Enhance your knowledge of the LNG industry with practical examples from Golar LNG.
- Educators and Students: Utilize it as an educational tool in energy finance and investment courses.
What the Template Contains
- Operating and Balance Sheet Data: Pre-filled Golar LNG Limited (GLNG) historical data and forecasts, including revenue, EBITDA, EBIT, and capital expenditures.
- WACC Calculation: A dedicated sheet for Weighted Average Cost of Capital (WACC), featuring parameters such as Beta, risk-free rate, and share price.
- DCF Valuation (Unlevered and Levered): Editable Discounted Cash Flow models that illustrate intrinsic value with comprehensive calculations.
- Financial Statements: Pre-loaded financial statements (annual and quarterly) to facilitate thorough analysis.
- Key Ratios: Includes profitability, leverage, and efficiency ratios for Golar LNG Limited (GLNG).
- Dashboard and Charts: Visual summary of valuation outputs and assumptions to simplify results analysis.
Disclaimer
All information, articles, and product details provided on this website are for general informational and educational purposes only. We do not claim any ownership over, nor do we intend to infringe upon, any trademarks, copyrights, logos, brand names, or other intellectual property mentioned or depicted on this site. Such intellectual property remains the property of its respective owners, and any references here are made solely for identification or informational purposes, without implying any affiliation, endorsement, or partnership.
We make no representations or warranties, express or implied, regarding the accuracy, completeness, or suitability of any content or products presented. Nothing on this website should be construed as legal, tax, investment, financial, medical, or other professional advice. In addition, no part of this site—including articles or product references—constitutes a solicitation, recommendation, endorsement, advertisement, or offer to buy or sell any securities, franchises, or other financial instruments, particularly in jurisdictions where such activity would be unlawful.
All content is of a general nature and may not address the specific circumstances of any individual or entity. It is not a substitute for professional advice or services. Any actions you take based on the information provided here are strictly at your own risk. You accept full responsibility for any decisions or outcomes arising from your use of this website and agree to release us from any liability in connection with your use of, or reliance upon, the content or products found herein.