
|
Fertilizantes do vale de Gujarat Narmada & Avaliação DCF Limited Limited Limited (GNFC.NS) |
Totalmente Editável: Adapte-Se Às Suas Necessidades No Excel Ou Planilhas
Design Profissional: Modelos Confiáveis E Padrão Da Indústria
Pré-Construídos Para Uso Rápido E Eficiente
Compatível com MAC/PC, totalmente desbloqueado
Não É Necessária Experiência; Fácil De Seguir
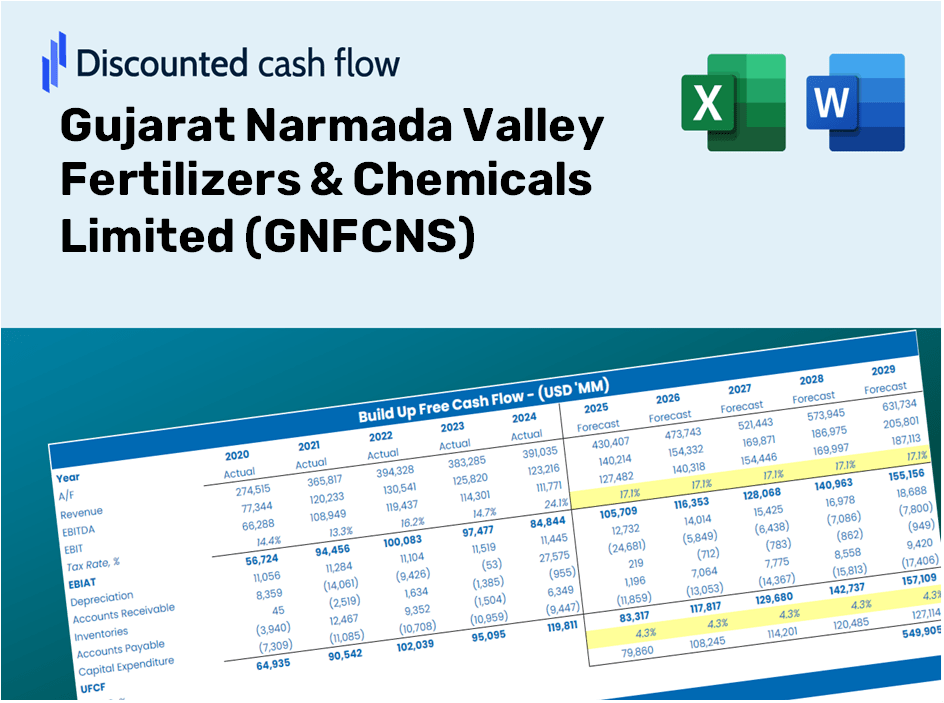
Gujarat Narmada Valley Fertilizers & Chemicals Limited (GNFC.NS) Bundle
Explore as perspectivas financeiras dos fertilizantes do vale de Gujarat Narmada & A Chemicals Limited (GNFCNS) usando nossa calculadora DCF amigável! Digite suas projeções de crescimento, margens e despesas para determinar o valor intrínseco dos GNFCNs e refine sua estratégia de investimento.
Discounted Cash Flow (DCF) - (USD MM)
| Year | AY1 2021 |
AY2 2022 |
AY3 2023 |
AY4 2024 |
AY5 2025 |
FY1 2026 |
FY2 2027 |
FY3 2028 |
FY4 2029 |
FY5 2030 |
|---|---|---|---|---|---|---|---|---|---|---|
| Revenue | 51,121.7 | 86,234.6 | 102,072.3 | 78,947.0 | 83,930.0 | 79,429.9 | 75,171.1 | 71,140.7 | 67,326.3 | 63,716.5 |
| Revenue Growth, % | 0 | 68.68 | 18.37 | -22.66 | 6.31 | -5.36 | -5.36 | -5.36 | -5.36 | -5.36 |
| EBITDA | 12,401.3 | 25,927.8 | 22,389.4 | 9,703.6 | 11,160.0 | 16,179.5 | 15,312.0 | 14,491.1 | 13,714.1 | 12,978.8 |
| EBITDA, % | 24.26 | 30.07 | 21.93 | 12.29 | 13.3 | 20.37 | 20.37 | 20.37 | 20.37 | 20.37 |
| Depreciation | 2,723.0 | 2,916.9 | 3,029.4 | 3,075.4 | 3,030.0 | 3,047.3 | 2,884.0 | 2,729.3 | 2,583.0 | 2,444.5 |
| Depreciation, % | 5.33 | 3.38 | 2.97 | 3.9 | 3.61 | 3.84 | 3.84 | 3.84 | 3.84 | 3.84 |
| EBIT | 9,678.3 | 23,010.9 | 19,360.0 | 6,628.2 | 8,130.0 | 13,132.2 | 12,428.1 | 11,761.7 | 11,131.1 | 10,534.3 |
| EBIT, % | 18.93 | 26.68 | 18.97 | 8.4 | 9.69 | 16.53 | 16.53 | 16.53 | 16.53 | 16.53 |
| Total Cash | 11,721.2 | 8,665.2 | 22,721.5 | 16,472.8 | 30,520.0 | 17,866.3 | 16,908.4 | 16,001.8 | 15,143.8 | 14,331.9 |
| Total Cash, percent | .0 | .0 | .0 | .0 | .0 | .0 | .0 | .0 | .0 | .0 |
| Account Receivables | 10,107.9 | 6,336.3 | 3,713.5 | 6,283.4 | 4,230.0 | 6,951.2 | 6,578.5 | 6,225.8 | 5,892.0 | 5,576.1 |
| Account Receivables, % | 19.77 | 7.35 | 3.64 | 7.96 | 5.04 | 8.75 | 8.75 | 8.75 | 8.75 | 8.75 |
| Inventories | 8,133.4 | 9,769.7 | 11,232.1 | 11,193.9 | 12,570.0 | 10,707.0 | 10,132.9 | 9,589.6 | 9,075.4 | 8,588.8 |
| Inventories, % | 15.91 | 11.33 | 11 | 14.18 | 14.98 | 13.48 | 13.48 | 13.48 | 13.48 | 13.48 |
| Accounts Payable | 2,788.0 | 5,265.4 | 5,181.5 | 5,307.6 | 4,950.0 | 4,647.7 | 4,398.5 | 4,162.7 | 3,939.5 | 3,728.3 |
| Accounts Payable, % | 5.45 | 6.11 | 5.08 | 6.72 | 5.9 | 5.85 | 5.85 | 5.85 | 5.85 | 5.85 |
| Capital Expenditure | -2,162.1 | -1,377.7 | -1,727.4 | -2,511.8 | -4,530.0 | -2,557.4 | -2,420.2 | -2,290.5 | -2,167.7 | -2,051.4 |
| Capital Expenditure, % | -4.23 | -1.6 | -1.69 | -3.18 | -5.4 | -3.22 | -3.22 | -3.22 | -3.22 | -3.22 |
| Tax Rate, % | 25.56 | 25.56 | 25.56 | 25.56 | 25.56 | 25.56 | 25.56 | 25.56 | 25.56 | 25.56 |
| EBITAT | 7,055.4 | 17,126.7 | 14,749.3 | 4,966.4 | 6,051.9 | 9,793.5 | 9,268.4 | 8,771.4 | 8,301.1 | 7,856.0 |
| Depreciation | ||||||||||
| Changes in Account Receivables | ||||||||||
| Changes in Inventories | ||||||||||
| Changes in Accounts Payable | ||||||||||
| Capital Expenditure | ||||||||||
| UFCF | -7,837.0 | 23,278.6 | 17,127.8 | 3,124.4 | 4,871.6 | 9,122.9 | 10,429.6 | 9,870.4 | 9,341.2 | 8,840.4 |
| WACC, % | 4.84 | 4.85 | 4.85 | 4.85 | 4.85 | 4.85 | 4.85 | 4.85 | 4.85 | 4.85 |
| PV UFCF | ||||||||||
| SUM PV UFCF | 41,459.8 | |||||||||
| Long Term Growth Rate, % | 3.50 | |||||||||
| Free cash flow (T + 1) | 9,150 | |||||||||
| Terminal Value | 679,199 | |||||||||
| Present Terminal Value | 536,060 | |||||||||
| Enterprise Value | 577,520 | |||||||||
| Net Debt | -22,030 | |||||||||
| Equity Value | 599,550 | |||||||||
| Diluted Shares Outstanding, MM | 147 | |||||||||
| Equity Value Per Share | 4,078.35 |
What You Will Receive
- Pre-Configured Financial Model: GNFC's actual data provides an accurate basis for DCF valuation.
- Comprehensive Forecast Control: Modify revenue growth, profit margins, WACC, and other essential parameters.
- Real-Time Calculations: Automatic updates allow you to view instant results as adjustments are made.
- Professional-Grade Template: A polished Excel file crafted for detailed and reliable valuation.
- Flexible and Reusable: Designed for adaptability, enabling repeated application for in-depth forecasts.
Key Features
- Comprehensive DCF Calculator: Offers detailed unlevered and levered DCF valuation models tailored for GNFCNS.
- WACC Calculator: Features a pre-constructed Weighted Average Cost of Capital sheet with adjustable parameters for GNFCNS.
- Customizable Forecast Assumptions: Alter growth projections, capital expenditures, and discount rates as needed.
- Integrated Financial Ratios: Evaluate profitability, leverage, and efficiency ratios specifically for Gujarat Narmada Valley Fertilizers & Chemicals Limited.
- User-Friendly Dashboard and Charts: Visual representations present essential valuation metrics for straightforward analysis.
How It Operates
- Download the Template: Obtain immediate access to the Excel-based GNFCNS DCF Calculator.
- Input Your Assumptions: Modify the yellow-highlighted cells for growth rates, WACC, profit margins, and other key factors.
- Instant Calculations: The model automatically recalculates the intrinsic value of GNFCNS.
- Test Scenarios: Explore various assumptions to assess potential changes in valuation.
- Analyze and Decide: Utilize the results to inform your investment or financial strategies.
Why Choose This Calculator for Gujarat Narmada Valley Fertilizers & Chemicals Limited (GNFCNS)?
- Accurate Data: Utilize real financial data from GNFCNS for trustworthy valuation outcomes.
- Customizable: Tailor key variables such as growth rates, WACC, and tax rates to align with your forecasts.
- Time-Saving: Built-in calculations allow you to bypass starting from the beginning.
- Professional-Grade Tool: Specifically crafted for investors, analysts, and financial consultants.
- User-Friendly: The intuitive design and straightforward instructions make it accessible for all users.
Who Can Benefit from This Product?
- Individual Investors: Gain insights to make well-informed choices regarding the purchase or sale of GNFCNS (Gujarat Narmada Valley Fertilizers & Chemicals Limited) shares.
- Financial Analysts: Enhance valuation workflows with accessible financial models tailored for GNFCNS (Gujarat Narmada Valley Fertilizers & Chemicals Limited).
- Consultants: Provide clients with swift and precise valuation analyses related to GNFCNS (Gujarat Narmada Valley Fertilizers & Chemicals Limited).
- Business Owners: Learn how to assess the valuation of prominent firms like GNFCNS (Gujarat Narmada Valley Fertilizers & Chemicals Limited) to inform your own business strategies.
- Finance Students: Explore valuation methodologies using actual data and case studies pertaining to GNFCNS (Gujarat Narmada Valley Fertilizers & Chemicals Limited).
Components of the GNFC Template
- Comprehensive DCF Model: Editable framework featuring detailed valuation calculations.
- Real-World Data: GNFC's historical and projected financials loaded for in-depth analysis.
- Customizable Parameters: Modify WACC, growth rates, and tax assumptions to explore various scenarios.
- Financial Statements: Complete annual and quarterly breakdowns for enhanced insights.
- Key Ratios: Integrated analysis for profitability, efficiency, and leverage metrics.
- Dashboard with Visual Outputs: Charts and tables providing clear, actionable insights.
Disclaimer
All information, articles, and product details provided on this website are for general informational and educational purposes only. We do not claim any ownership over, nor do we intend to infringe upon, any trademarks, copyrights, logos, brand names, or other intellectual property mentioned or depicted on this site. Such intellectual property remains the property of its respective owners, and any references here are made solely for identification or informational purposes, without implying any affiliation, endorsement, or partnership.
We make no representations or warranties, express or implied, regarding the accuracy, completeness, or suitability of any content or products presented. Nothing on this website should be construed as legal, tax, investment, financial, medical, or other professional advice. In addition, no part of this site—including articles or product references—constitutes a solicitation, recommendation, endorsement, advertisement, or offer to buy or sell any securities, franchises, or other financial instruments, particularly in jurisdictions where such activity would be unlawful.
All content is of a general nature and may not address the specific circumstances of any individual or entity. It is not a substitute for professional advice or services. Any actions you take based on the information provided here are strictly at your own risk. You accept full responsibility for any decisions or outcomes arising from your use of this website and agree to release us from any liability in connection with your use of, or reliance upon, the content or products found herein.