
|
Gujarat Pipavav Port Limited (GPPL.NS) Avaliação DCF |
Totalmente Editável: Adapte-Se Às Suas Necessidades No Excel Ou Planilhas
Design Profissional: Modelos Confiáveis E Padrão Da Indústria
Pré-Construídos Para Uso Rápido E Eficiente
Compatível com MAC/PC, totalmente desbloqueado
Não É Necessária Experiência; Fácil De Seguir
Gujarat Pipavav Port Limited (GPPL.NS) Bundle
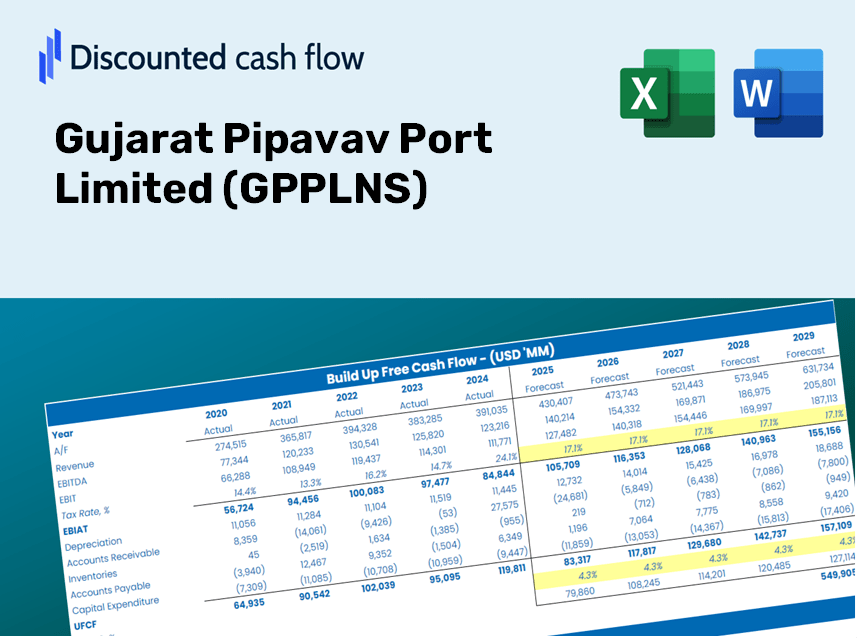
Aprimore suas estratégias de investimento com a calculadora GPPLNS DCF! Utilize dados financeiros precisos para Gujarat Pipavav Port Limited, ajuste as projeções e despesas de crescimento e observe como essas modificações afetam o valor intrínseco dos GPPLNs em tempo real.
Discounted Cash Flow (DCF) - (USD MM)
| Year | AY1 2021 |
AY2 2022 |
AY3 2023 |
AY4 2024 |
AY5 2025 |
FY1 2026 |
FY2 2027 |
FY3 2028 |
FY4 2029 |
FY5 2030 |
|---|---|---|---|---|---|---|---|---|---|---|
| Revenue | 6,835.5 | 7,435.4 | 9,169.5 | 9,206.8 | 9,876.7 | 10,859.0 | 11,939.0 | 13,126.4 | 14,431.9 | 15,867.2 |
| Revenue Growth, % | 0 | 8.78 | 23.32 | 0.40667 | 7.28 | 9.95 | 9.95 | 9.95 | 9.95 | 9.95 |
| EBITDA | 4,625.2 | 4,365.4 | 5,159.7 | 5,943.3 | 6,586.2 | 6,816.9 | 7,494.9 | 8,240.3 | 9,059.8 | 9,960.9 |
| EBITDA, % | 67.66 | 58.71 | 56.27 | 64.55 | 66.68 | 62.78 | 62.78 | 62.78 | 62.78 | 62.78 |
| Depreciation | 1,334.5 | 1,292.7 | 1,161.5 | 1,156.0 | 1,170.6 | 1,606.8 | 1,766.6 | 1,942.3 | 2,135.5 | 2,347.9 |
| Depreciation, % | 19.52 | 17.39 | 12.67 | 12.56 | 11.85 | 14.8 | 14.8 | 14.8 | 14.8 | 14.8 |
| EBIT | 3,290.7 | 3,072.7 | 3,998.2 | 4,787.3 | 5,415.6 | 5,210.1 | 5,728.3 | 6,298.0 | 6,924.4 | 7,613.0 |
| EBIT, % | 48.14 | 41.32 | 43.6 | 52 | 54.83 | 47.98 | 47.98 | 47.98 | 47.98 | 47.98 |
| Total Cash | 7,246.0 | 8,549.1 | 9,360.2 | 10,445.7 | 10,689.3 | 10,859.0 | 11,939.0 | 13,126.4 | 14,431.9 | 15,867.2 |
| Total Cash, percent | .0 | .0 | .0 | .0 | .0 | .0 | .0 | .0 | .0 | .0 |
| Account Receivables | 505.9 | 542.2 | 880.3 | 576.7 | 478.8 | 768.9 | 845.4 | 929.5 | 1,021.9 | 1,123.5 |
| Account Receivables, % | 7.4 | 7.29 | 9.6 | 6.26 | 4.85 | 7.08 | 7.08 | 7.08 | 7.08 | 7.08 |
| Inventories | 104.9 | 202.8 | 227.6 | 121.5 | 99.2 | 197.0 | 216.6 | 238.1 | 261.8 | 287.8 |
| Inventories, % | 1.53 | 2.73 | 2.48 | 1.32 | 1 | 1.81 | 1.81 | 1.81 | 1.81 | 1.81 |
| Accounts Payable | 339.5 | 444.6 | 659.1 | 604.0 | 556.1 | 658.6 | 724.1 | 796.1 | 875.3 | 962.3 |
| Accounts Payable, % | 4.97 | 5.98 | 7.19 | 6.56 | 5.63 | 6.06 | 6.06 | 6.06 | 6.06 | 6.06 |
| Capital Expenditure | -454.8 | -511.1 | -578.3 | -712.7 | -954.1 | -808.7 | -889.1 | -977.5 | -1,074.7 | -1,181.6 |
| Capital Expenditure, % | -6.65 | -6.87 | -6.31 | -7.74 | -9.66 | -7.45 | -7.45 | -7.45 | -7.45 | -7.45 |
| Tax Rate, % | 28.15 | 28.15 | 28.15 | 28.15 | 28.15 | 28.15 | 28.15 | 28.15 | 28.15 | 28.15 |
| EBITAT | 2,212.5 | 1,977.6 | 3,029.8 | 3,414.6 | 3,891.2 | 3,652.9 | 4,016.2 | 4,415.6 | 4,854.7 | 5,337.6 |
| Depreciation | ||||||||||
| Changes in Account Receivables | ||||||||||
| Changes in Inventories | ||||||||||
| Changes in Accounts Payable | ||||||||||
| Capital Expenditure | ||||||||||
| UFCF | 2,820.9 | 2,730.1 | 3,464.7 | 4,212.6 | 4,180.1 | 4,165.6 | 4,863.1 | 5,346.8 | 5,878.5 | 6,463.2 |
| WACC, % | 5.42 | 5.42 | 5.43 | 5.42 | 5.42 | 5.42 | 5.42 | 5.42 | 5.42 | 5.42 |
| PV UFCF | ||||||||||
| SUM PV UFCF | 22,612.6 | |||||||||
| Long Term Growth Rate, % | 3.00 | |||||||||
| Free cash flow (T + 1) | 6,657 | |||||||||
| Terminal Value | 274,732 | |||||||||
| Present Terminal Value | 210,974 | |||||||||
| Enterprise Value | 233,587 | |||||||||
| Net Debt | -10,056 | |||||||||
| Equity Value | 243,643 | |||||||||
| Diluted Shares Outstanding, MM | 482 | |||||||||
| Equity Value Per Share | 505.07 |
Benefits You Will Receive
- Authentic GPPLNS Data: Comprehensive financials – including revenue and EBIT – based on both actual and forecasted figures.
- Complete Customization: Modify all essential parameters (highlighted cells) such as WACC, growth rates, and tax percentages.
- Real-Time Valuation Adjustments: Automatic recalculations that assess the effects of changes on GPPLNS’s fair value.
- Flexible Excel Template: Designed for easy adjustments, scenario analysis, and in-depth forecasting.
- Efficient and Precise: Eliminate the need to build models from the ground up while ensuring accuracy and adaptability.
Key Features
- Comprehensive DCF Calculator: Offers detailed unlevered and levered DCF valuation models tailored for Gujarat Pipavav Port Limited (GPPLNS).
- WACC Calculator: Features a pre-configured Weighted Average Cost of Capital sheet with adjustable inputs for precise calculations.
- Customizable Forecast Assumptions: Easily modify growth rates, capital expenditures, and discount rates to suit your analysis.
- Integrated Financial Ratios: Evaluate profitability, leverage, and efficiency ratios specifically for Gujarat Pipavav Port Limited (GPPLNS).
- Interactive Dashboard and Charts: Visual presentations summarize key valuation metrics for straightforward analysis.
How It Works
- Step 1: Download the pre-built Excel template featuring Gujarat Pipavav Port Limited’s (GPPLNS) data.
- Step 2: Review the pre-filled sheets to familiarize yourself with key performance metrics.
- Step 3: Modify forecasts and assumptions in the editable yellow cells (WACC, growth, margins).
- Step 4: Instantly view updated results, including the intrinsic value of Gujarat Pipavav Port Limited (GPPLNS).
- Step 5: Utilize the outputs to make informed investment decisions or to create detailed reports.
Why Choose This Calculator for Gujarat Pipavav Port Limited (GPPLNS)?
- Reliable Data: Accurate financials from GPPLNS guarantee trustworthy valuation outcomes.
- Flexible Options: Tailor key inputs such as growth rates, WACC, and tax rates to align with your forecasts.
- Efficient: Built-in calculations save you the hassle of starting from the ground up.
- Professional Quality: Crafted for investors, analysts, and consultants in the port sector.
- User-Centric: Easy-to-navigate interface and clear instructions simplify usage for everyone.
Who Can Benefit from Gujarat Pipavav Port Limited (GPPLNS)?
- Investors: Gain reassurance in your investment choices with a professional valuation tool tailored for GPPLNS.
- Financial Analysts: Enhance efficiency with a customizable, pre-built DCF model specifically for GPPLNS.
- Consultants: Effortlessly modify the template for client presentations or reports concerning GPPLNS.
- Finance Enthusiasts: Expand your knowledge of valuation methods through practical, real-world examples related to GPPLNS.
- Educators and Students: Utilize it as a hands-on resource in finance courses that focus on GPPLNS.
What the Template Contains
- Preloaded GPPLNS Data: Historical and projected financial information, including revenue, EBIT, and capital expenditures.
- DCF and WACC Models: Professional-grade spreadsheets for calculating intrinsic value and Weighted Average Cost of Capital.
- Editable Inputs: Yellow-highlighted cells for modifying revenue growth, tax rates, and discount rates.
- Financial Statements: Detailed annual and quarterly financials for in-depth analysis.
- Key Ratios: Profitability, leverage, and efficiency ratios to assess operational performance.
- Dashboard and Charts: Visual representations of valuation results and underlying assumptions.
Disclaimer
All information, articles, and product details provided on this website are for general informational and educational purposes only. We do not claim any ownership over, nor do we intend to infringe upon, any trademarks, copyrights, logos, brand names, or other intellectual property mentioned or depicted on this site. Such intellectual property remains the property of its respective owners, and any references here are made solely for identification or informational purposes, without implying any affiliation, endorsement, or partnership.
We make no representations or warranties, express or implied, regarding the accuracy, completeness, or suitability of any content or products presented. Nothing on this website should be construed as legal, tax, investment, financial, medical, or other professional advice. In addition, no part of this site—including articles or product references—constitutes a solicitation, recommendation, endorsement, advertisement, or offer to buy or sell any securities, franchises, or other financial instruments, particularly in jurisdictions where such activity would be unlawful.
All content is of a general nature and may not address the specific circumstances of any individual or entity. It is not a substitute for professional advice or services. Any actions you take based on the information provided here are strictly at your own risk. You accept full responsibility for any decisions or outcomes arising from your use of this website and agree to release us from any liability in connection with your use of, or reliance upon, the content or products found herein.