
|
Avaliação DCF GrowGeneration Corp. (GRWG) |
Totalmente Editável: Adapte-Se Às Suas Necessidades No Excel Ou Planilhas
Design Profissional: Modelos Confiáveis E Padrão Da Indústria
Pré-Construídos Para Uso Rápido E Eficiente
Compatível com MAC/PC, totalmente desbloqueado
Não É Necessária Experiência; Fácil De Seguir
GrowGeneration Corp. (GRWG) Bundle
Desbloquear o valor verdadeiro GrowGegeneration Corp. (GRWG) com nossa calculadora DCF de nível profissional! Ajuste as principais suposições, explore vários cenários e avalie como as mudanças afetam a avaliação Growgeneration Corp. (GRWG) - tudo dentro de um único modelo do Excel.
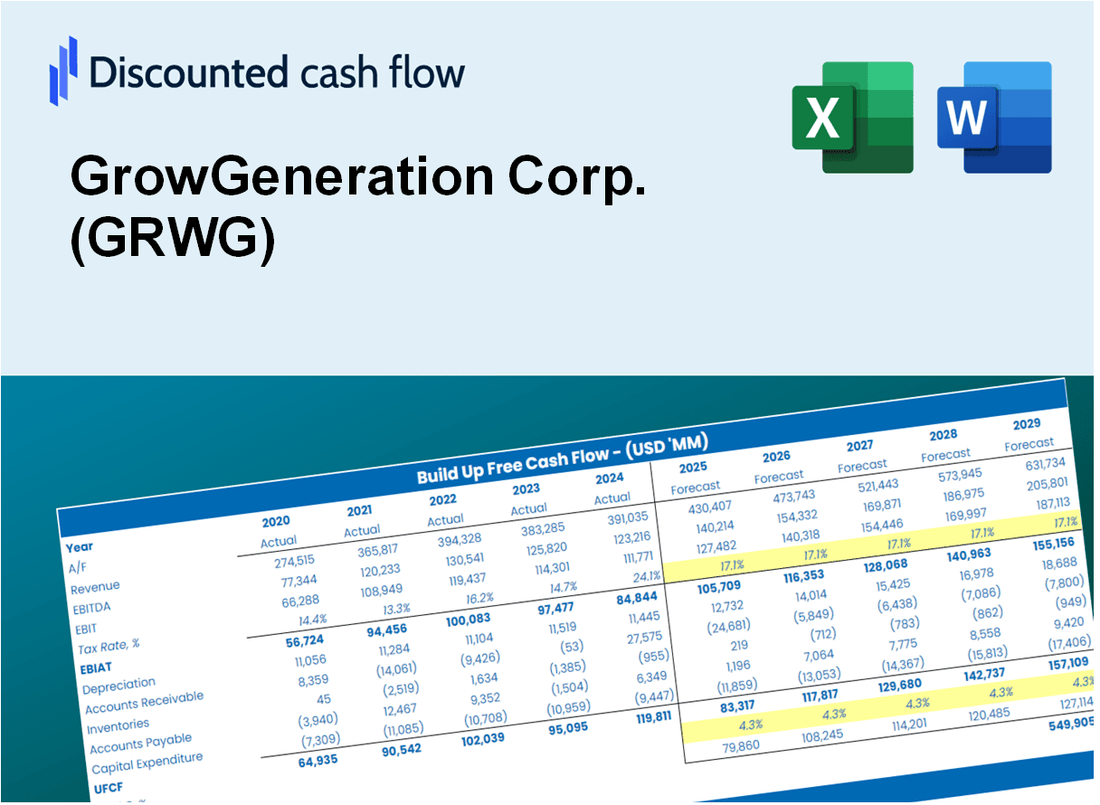
Discounted Cash Flow (DCF) - (USD MM)
| Year | AY1 2020 |
AY2 2021 |
AY3 2022 |
AY4 2023 |
AY5 2024 |
FY1 2025 |
FY2 2026 |
FY3 2027 |
FY4 2028 |
FY5 2029 |
|---|---|---|---|---|---|---|---|---|---|---|
| Revenue | 193.4 | 422.5 | 278.2 | 225.9 | 188.9 | 203.3 | 218.9 | 235.7 | 253.8 | 273.2 |
| Revenue Growth, % | 0 | 118.49 | -34.16 | -18.8 | -16.39 | 7.66 | 7.66 | 7.66 | 7.66 | 7.66 |
| EBITDA | 11.0 | 27.9 | -149.5 | -29.8 | -29.8 | -28.6 | -30.8 | -33.2 | -35.7 | -38.5 |
| EBITDA, % | 5.7 | 6.6 | -53.74 | -13.18 | -15.8 | -14.08 | -14.08 | -14.08 | -14.08 | -14.08 |
| Depreciation | 2.4 | 12.6 | 17.1 | 16.6 | 19.4 | 11.4 | 12.3 | 13.2 | 14.2 | 15.3 |
| Depreciation, % | 1.26 | 2.98 | 6.16 | 7.35 | 10.29 | 5.61 | 5.61 | 5.61 | 5.61 | 5.61 |
| EBIT | 8.6 | 15.3 | -166.6 | -46.4 | -49.3 | -40.0 | -43.1 | -46.4 | -50.0 | -53.8 |
| EBIT, % | 4.44 | 3.61 | -59.9 | -20.53 | -26.09 | -19.69 | -19.69 | -19.69 | -19.69 | -19.69 |
| Total Cash | 177.9 | 81.2 | 71.9 | 65.0 | 56.5 | 79.6 | 85.7 | 92.3 | 99.3 | 107.0 |
| Total Cash, percent | .0 | .0 | .0 | .0 | .0 | .0 | .0 | .0 | .0 | .0 |
| Account Receivables | 6.5 | 8.2 | 9.6 | 9.1 | 8.4 | 7.0 | 7.5 | 8.1 | 8.7 | 9.4 |
| Account Receivables, % | 3.37 | 1.94 | 3.43 | 4.02 | 4.46 | 3.44 | 3.44 | 3.44 | 3.44 | 3.44 |
| Inventories | 54.0 | 105.6 | 77.1 | 64.9 | 40.3 | 53.2 | 57.2 | 61.6 | 66.3 | 71.4 |
| Inventories, % | 27.94 | 24.99 | 27.71 | 28.73 | 21.34 | 26.14 | 26.14 | 26.14 | 26.14 | 26.14 |
| Accounts Payable | 14.6 | 17.0 | 15.7 | 11.7 | 8.1 | 10.9 | 11.7 | 12.6 | 13.6 | 14.6 |
| Accounts Payable, % | 7.56 | 4.03 | 5.65 | 5.16 | 4.31 | 5.35 | 5.35 | 5.35 | 5.35 | 5.35 |
| Capital Expenditure | -4.4 | -18.7 | -12.9 | -6.7 | -2.0 | -6.3 | -6.7 | -7.2 | -7.8 | -8.4 |
| Capital Expenditure, % | -2.29 | -4.44 | -4.64 | -2.97 | -1.05 | -3.07 | -3.07 | -3.07 | -3.07 | -3.07 |
| Tax Rate, % | -0.32015 | -0.32015 | -0.32015 | -0.32015 | -0.32015 | -0.32015 | -0.32015 | -0.32015 | -0.32015 | -0.32015 |
| EBITAT | 5.3 | 12.8 | -163.7 | -46.4 | -49.4 | -35.6 | -38.3 | -41.2 | -44.4 | -47.8 |
| Depreciation | ||||||||||
| Changes in Account Receivables | ||||||||||
| Changes in Inventories | ||||||||||
| Changes in Accounts Payable | ||||||||||
| Capital Expenditure | ||||||||||
| UFCF | -42.6 | -44.1 | -133.7 | -27.9 | -10.2 | -39.2 | -36.5 | -39.3 | -42.4 | -45.6 |
| WACC, % | 11.67 | 11.89 | 12.04 | 12.05 | 12.05 | 11.94 | 11.94 | 11.94 | 11.94 | 11.94 |
| PV UFCF | ||||||||||
| SUM PV UFCF | -145.1 | |||||||||
| Long Term Growth Rate, % | 2.00 | |||||||||
| Free cash flow (T + 1) | -47 | |||||||||
| Terminal Value | -468 | |||||||||
| Present Terminal Value | -266 | |||||||||
| Enterprise Value | -411 | |||||||||
| Net Debt | 10 | |||||||||
| Equity Value | -421 | |||||||||
| Diluted Shares Outstanding, MM | 60 | |||||||||
| Equity Value Per Share | -6.99 |
What You Will Get
- Real GRWG Financial Data: Pre-filled with GrowGeneration’s historical and projected data for precise analysis.
- Fully Editable Template: Modify key inputs like revenue growth, WACC, and EBITDA % with ease.
- Automatic Calculations: See GrowGeneration’s intrinsic value update instantly based on your changes.
- Professional Valuation Tool: Designed for investors, analysts, and consultants seeking accurate DCF results.
- User-Friendly Design: Simple structure and clear instructions for all experience levels.
Key Features
- 🔍 Real-Life GRWG Financials: Pre-filled historical and projected data for GrowGeneration Corp.
- ✏️ Fully Customizable Inputs: Adjust all critical parameters (yellow cells) like WACC, growth %, and tax rates.
- 📊 Professional DCF Valuation: Built-in formulas calculate GrowGeneration’s intrinsic value using the Discounted Cash Flow method.
- ⚡ Instant Results: Visualize GrowGeneration’s valuation instantly after making changes.
- Scenario Analysis: Test and compare outcomes for various financial assumptions side-by-side.
How It Works
- Download the Template: Gain immediate access to the Excel-based GRWG DCF Calculator.
- Input Your Assumptions: Modify the yellow-highlighted cells for growth rates, WACC, margins, and other variables.
- Instant Calculations: The model automatically recalculates GrowGeneration's intrinsic value.
- Test Scenarios: Experiment with various assumptions to assess potential changes in valuation.
- Analyze and Decide: Leverage the results to inform your investment or financial analysis.
Why Choose This Calculator for GrowGeneration Corp. (GRWG)?
- Accurate Data: Utilize real GrowGeneration financials for dependable valuation outcomes.
- Customizable: Modify essential parameters such as growth rates, WACC, and tax rates to align with your forecasts.
- Time-Saving: Pre-configured calculations save you the effort of starting from the ground up.
- Professional-Grade Tool: Tailored for investors, analysts, and consultants in the cannabis industry.
- User-Friendly: Easy-to-navigate design and comprehensive instructions cater to users of all experience levels.
Who Should Use This Product?
- Professional Investors: Develop comprehensive and accurate valuation models for analyzing GrowGeneration Corp. (GRWG) investments.
- Corporate Finance Teams: Evaluate valuation scenarios to inform strategic decisions within the organization.
- Consultants and Advisors: Offer clients precise valuation insights for GrowGeneration Corp. (GRWG) stock.
- Students and Educators: Utilize real-world data to practice and teach financial modeling techniques related to the cannabis industry.
- Industry Enthusiasts: Gain insights into how companies like GrowGeneration Corp. (GRWG) are valued in the burgeoning cannabis market.
What the Template Contains
- Pre-Filled Data: Includes GrowGeneration Corp.'s historical financials and forecasts.
- Discounted Cash Flow Model: Editable DCF valuation model with automatic calculations.
- Weighted Average Cost of Capital (WACC): A dedicated sheet for calculating WACC based on custom inputs.
- Key Financial Ratios: Analyze GrowGeneration Corp.'s profitability, efficiency, and leverage.
- Customizable Inputs: Edit revenue growth, margins, and tax rates with ease.
- Clear Dashboard: Charts and tables summarizing key valuation results.
Disclaimer
All information, articles, and product details provided on this website are for general informational and educational purposes only. We do not claim any ownership over, nor do we intend to infringe upon, any trademarks, copyrights, logos, brand names, or other intellectual property mentioned or depicted on this site. Such intellectual property remains the property of its respective owners, and any references here are made solely for identification or informational purposes, without implying any affiliation, endorsement, or partnership.
We make no representations or warranties, express or implied, regarding the accuracy, completeness, or suitability of any content or products presented. Nothing on this website should be construed as legal, tax, investment, financial, medical, or other professional advice. In addition, no part of this site—including articles or product references—constitutes a solicitation, recommendation, endorsement, advertisement, or offer to buy or sell any securities, franchises, or other financial instruments, particularly in jurisdictions where such activity would be unlawful.
All content is of a general nature and may not address the specific circumstances of any individual or entity. It is not a substitute for professional advice or services. Any actions you take based on the information provided here are strictly at your own risk. You accept full responsibility for any decisions or outcomes arising from your use of this website and agree to release us from any liability in connection with your use of, or reliance upon, the content or products found herein.