
|
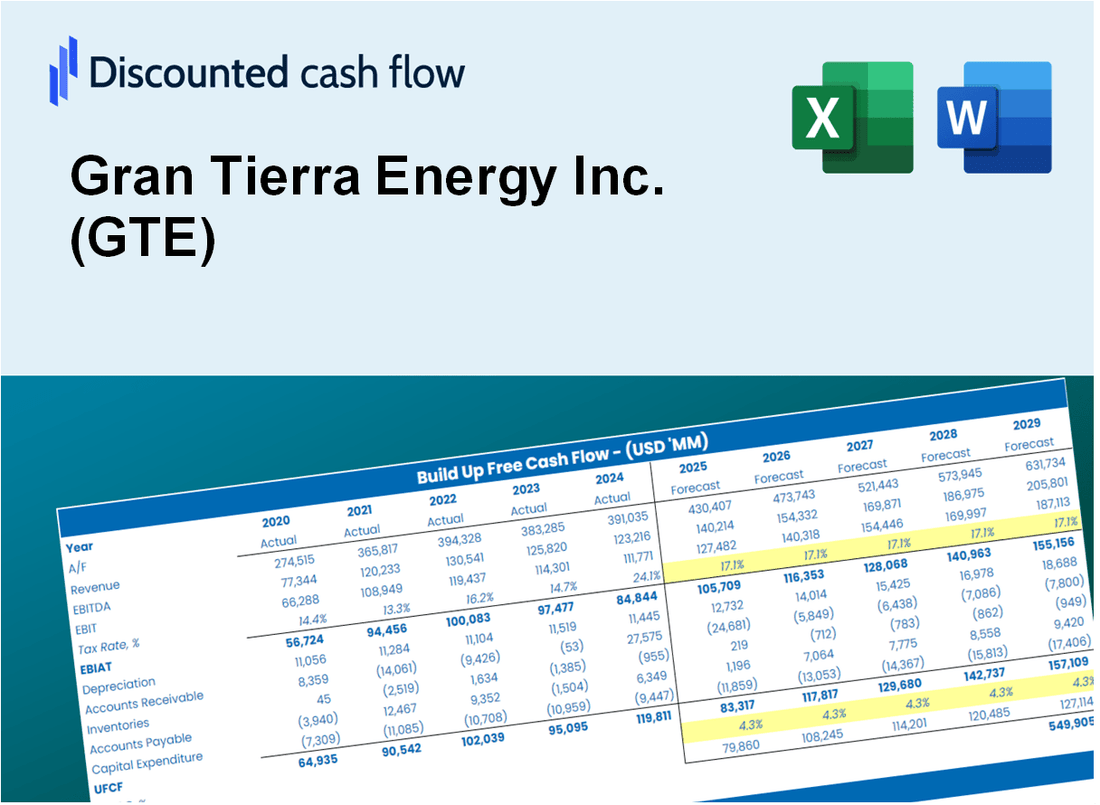
Gran Tierra Energy Inc. (GTE) Avaliação DCF |
Totalmente Editável: Adapte-Se Às Suas Necessidades No Excel Ou Planilhas
Design Profissional: Modelos Confiáveis E Padrão Da Indústria
Pré-Construídos Para Uso Rápido E Eficiente
Compatível com MAC/PC, totalmente desbloqueado
Não É Necessária Experiência; Fácil De Seguir
Gran Tierra Energy Inc. (GTE) Bundle
Descubra o verdadeiro potencial da Gran Tierra Energy Inc. (GTE) com nossa calculadora DCF de nível profissional! Ajuste as principais suposições, explore vários cenários e avalie como as mudanças afetam a avaliação da Gran Tierra Energy Inc. (GTE) - tudo em um modelo conveniente do Excel.
What You Will Get
- Editable Excel Template: A fully customizable Excel-based DCF Calculator featuring pre-filled real GTE financials.
- Real-World Data: Historical data and forward-looking estimates (as displayed in the yellow cells).
- Forecast Flexibility: Adjust forecast assumptions such as revenue growth, EBITDA %, and WACC.
- Automatic Calculations: Quickly observe the effects of your inputs on Gran Tierra Energy’s valuation.
- Professional Tool: Designed for investors, CFOs, consultants, and financial analysts.
- User-Friendly Design: Organized for clarity and ease of use, complete with step-by-step instructions.
Key Features
- Comprehensive Data Access: Gran Tierra Energy Inc.'s (GTE) historical financial records and projected forecasts.
- Customizable Parameters: Adjust WACC, tax rates, production growth, and operating margins to fit your analysis.
- Real-Time Insights: Monitor Gran Tierra Energy Inc.'s (GTE) intrinsic value as it updates instantly.
- Intuitive Visualizations: Interactive dashboard charts present valuation outcomes and essential metrics.
- Designed for Precision: A reliable tool tailored for analysts, investors, and finance professionals.
How It Works
- 1. Access the Template: Download and open the Excel file containing Gran Tierra Energy Inc.'s (GTE) preloaded data.
- 2. Modify Assumptions: Adjust key inputs such as growth rates, WACC, and capital expenditures specific to (GTE).
- 3. Analyze Results Immediately: The DCF model automatically computes intrinsic value and NPV for (GTE).
- 4. Evaluate Scenarios: Explore various forecasts to assess different valuation scenarios for (GTE).
- 5. Present with Assurance: Deliver professional valuation insights to back your strategic decisions regarding (GTE).
Why Choose Gran Tierra Energy Inc. (GTE) Calculator?
- Accuracy: Utilizes real Gran Tierra Energy financials for precise data.
- Flexibility: Tailored for users to easily test and adjust inputs as needed.
- Time-Saving: Eliminate the complexities of creating a financial model from the ground up.
- Professional-Grade: Crafted with the expertise and usability expected at the CFO level.
- User-Friendly: Intuitive design makes it accessible for users without extensive financial modeling skills.
Who Should Use Gran Tierra Energy Inc. (GTE)?
- Investors: Accurately assess Gran Tierra Energy's fair value before making investment choices.
- CFOs: Utilize a professional-grade DCF model for comprehensive financial reporting and analysis.
- Consultants: Efficiently customize the template for valuation reports tailored to clients in the energy sector.
- Entrepreneurs: Acquire insights into financial modeling practices employed by leading energy companies.
- Educators: Implement it as a teaching resource to illustrate valuation methodologies in the energy industry.
What the Template Contains
- Historical Data: Includes Gran Tierra Energy Inc. (GTE)’s past financials and baseline forecasts.
- DCF and Levered DCF Models: Detailed templates to calculate Gran Tierra Energy Inc. (GTE)’s intrinsic value.
- WACC Sheet: Pre-built calculations for Weighted Average Cost of Capital.
- Editable Inputs: Modify key drivers like growth rates, EBITDA %, and CAPEX assumptions.
- Quarterly and Annual Statements: A complete breakdown of Gran Tierra Energy Inc. (GTE)’s financials.
- Interactive Dashboard: Visualize valuation results and projections dynamically.
Disclaimer
All information, articles, and product details provided on this website are for general informational and educational purposes only. We do not claim any ownership over, nor do we intend to infringe upon, any trademarks, copyrights, logos, brand names, or other intellectual property mentioned or depicted on this site. Such intellectual property remains the property of its respective owners, and any references here are made solely for identification or informational purposes, without implying any affiliation, endorsement, or partnership.
We make no representations or warranties, express or implied, regarding the accuracy, completeness, or suitability of any content or products presented. Nothing on this website should be construed as legal, tax, investment, financial, medical, or other professional advice. In addition, no part of this site—including articles or product references—constitutes a solicitation, recommendation, endorsement, advertisement, or offer to buy or sell any securities, franchises, or other financial instruments, particularly in jurisdictions where such activity would be unlawful.
All content is of a general nature and may not address the specific circumstances of any individual or entity. It is not a substitute for professional advice or services. Any actions you take based on the information provided here are strictly at your own risk. You accept full responsibility for any decisions or outcomes arising from your use of this website and agree to release us from any liability in connection with your use of, or reliance upon, the content or products found herein.