
|
Gates Industrial Corporation plc (GTES) Avaliação DCF |
Totalmente Editável: Adapte-Se Às Suas Necessidades No Excel Ou Planilhas
Design Profissional: Modelos Confiáveis E Padrão Da Indústria
Pré-Construídos Para Uso Rápido E Eficiente
Compatível com MAC/PC, totalmente desbloqueado
Não É Necessária Experiência; Fácil De Seguir
Gates Industrial Corporation plc (GTES) Bundle
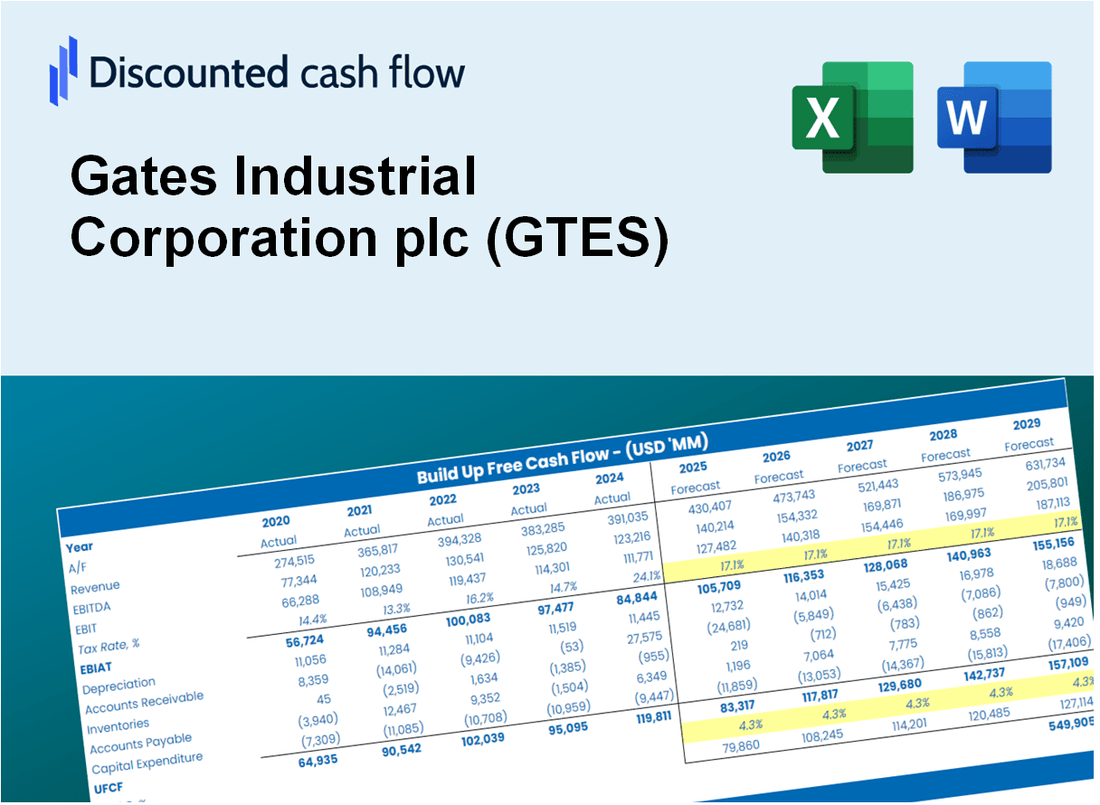
Simplifique a avaliação Gates Industrial Corporation Plc (GTES) com esta calculadora DCF personalizável! Com a Real Gates Industrial Corporation plc (GTES) financeiras e insumos de previsão ajustáveis, você pode testar cenários e descobrir o valor justo da Gates Industrial Corporation plc (GTES) em minutos.
Discounted Cash Flow (DCF) - (USD MM)
| Year | AY1 2020 |
AY2 2021 |
AY3 2022 |
AY4 2023 |
AY5 2024 |
FY1 2025 |
FY2 2026 |
FY3 2027 |
FY4 2028 |
FY5 2029 |
|---|---|---|---|---|---|---|---|---|---|---|
| Revenue | 2,793.0 | 3,474.4 | 3,554.2 | 3,570.2 | 3,408.2 | 3,600.8 | 3,804.3 | 4,019.3 | 4,246.5 | 4,486.5 |
| Revenue Growth, % | 0 | 24.4 | 2.3 | 0.45017 | -4.54 | 5.65 | 5.65 | 5.65 | 5.65 | 5.65 |
| EBITDA | 443.9 | 705.8 | 614.4 | 656.9 | 677.6 | 660.9 | 698.3 | 737.7 | 779.4 | 823.5 |
| EBITDA, % | 15.89 | 20.31 | 17.29 | 18.4 | 19.88 | 18.36 | 18.36 | 18.36 | 18.36 | 18.36 |
| Depreciation | 218.6 | 222.6 | 217.2 | 217.5 | 216.9 | 236.2 | 249.6 | 263.7 | 278.6 | 294.3 |
| Depreciation, % | 7.83 | 6.41 | 6.11 | 6.09 | 6.36 | 6.56 | 6.56 | 6.56 | 6.56 | 6.56 |
| EBIT | 225.3 | 483.2 | 397.2 | 439.4 | 460.7 | 424.7 | 448.7 | 474.1 | 500.9 | 529.2 |
| EBIT, % | 8.07 | 13.91 | 11.18 | 12.31 | 13.52 | 11.79 | 11.79 | 11.79 | 11.79 | 11.79 |
| Total Cash | 521.4 | 658.2 | 578.4 | 720.6 | 682.0 | 677.5 | 715.8 | 756.3 | 799.0 | 844.2 |
| Total Cash, percent | .0 | .0 | .0 | .0 | .0 | .0 | .0 | .0 | .0 | .0 |
| Account Receivables | 723.6 | 727.2 | 821.6 | 798.6 | 751.3 | 823.6 | 870.2 | 919.4 | 971.3 | 1,026.2 |
| Account Receivables, % | 25.91 | 20.93 | 23.12 | 22.37 | 22.04 | 22.87 | 22.87 | 22.87 | 22.87 | 22.87 |
| Inventories | 508.2 | 682.6 | 656.2 | 647.2 | 676.0 | 678.9 | 717.2 | 757.8 | 800.6 | 845.9 |
| Inventories, % | 18.2 | 19.65 | 18.46 | 18.13 | 19.83 | 18.85 | 18.85 | 18.85 | 18.85 | 18.85 |
| Accounts Payable | 417.4 | 506.6 | 469.6 | 457.7 | 408.2 | 486.4 | 513.8 | 542.9 | 573.6 | 606.0 |
| Accounts Payable, % | 14.94 | 14.58 | 13.21 | 12.82 | 11.98 | 13.51 | 13.51 | 13.51 | 13.51 | 13.51 |
| Capital Expenditure | -67.4 | -87.0 | -87.0 | -61.2 | -83.1 | -82.9 | -87.6 | -92.6 | -97.8 | -103.3 |
| Capital Expenditure, % | -2.41 | -2.5 | -2.45 | -1.71 | -2.44 | -2.3 | -2.3 | -2.3 | -2.3 | -2.3 |
| Tax Rate, % | 40.58 | 40.58 | 40.58 | 40.58 | 40.58 | 40.58 | 40.58 | 40.58 | 40.58 | 40.58 |
| EBITAT | 252.0 | 410.5 | 340.2 | 358.7 | 273.8 | 349.7 | 369.4 | 390.3 | 412.4 | 435.7 |
| Depreciation | ||||||||||
| Changes in Account Receivables | ||||||||||
| Changes in Inventories | ||||||||||
| Changes in Accounts Payable | ||||||||||
| Capital Expenditure | ||||||||||
| UFCF | -411.2 | 457.3 | 365.4 | 535.1 | 376.6 | 505.9 | 473.9 | 500.7 | 529.0 | 558.9 |
| WACC, % | 8.71 | 8.41 | 8.42 | 8.34 | 7.88 | 8.35 | 8.35 | 8.35 | 8.35 | 8.35 |
| PV UFCF | ||||||||||
| SUM PV UFCF | 2,022.3 | |||||||||
| Long Term Growth Rate, % | 2.00 | |||||||||
| Free cash flow (T + 1) | 570 | |||||||||
| Terminal Value | 8,974 | |||||||||
| Present Terminal Value | 6,009 | |||||||||
| Enterprise Value | 8,031 | |||||||||
| Net Debt | 1,828 | |||||||||
| Equity Value | 6,203 | |||||||||
| Diluted Shares Outstanding, MM | 263 | |||||||||
| Equity Value Per Share | 23.55 |
What You Will Get
- Editable Excel Template: A fully customizable Excel-based DCF Calculator featuring pre-filled real GTES financials.
- Real-World Data: Historical data and forward-looking estimates (as indicated in the yellow cells).
- Forecast Flexibility: Adjust forecast assumptions such as revenue growth, EBITDA %, and WACC.
- Automatic Calculations: Instantly observe how your inputs affect Gates Industrial Corporation's valuation.
- Professional Tool: Designed for investors, CFOs, consultants, and financial analysts.
- User-Friendly Design: Organized for clarity and ease of use, complete with step-by-step instructions.
Key Features
- Customizable Financial Inputs: Adjust essential metrics such as revenue growth, operating margin, and capital investments.
- Instant DCF Valuation: Quickly computes intrinsic value, net present value (NPV), and additional financial metrics.
- High-Precision Accuracy: Leverages Gates Industrial's actual financial data for dependable valuation results.
- Effortless Scenario Analysis: Easily experiment with various assumptions and evaluate different outcomes.
- Efficiency Booster: Streamline the valuation process without the need for intricate model development.
How It Works
- Step 1: Download the prebuilt Excel template featuring Gates Industrial Corporation plc's (GTES) data.
- Step 2: Navigate through the pre-filled sheets to familiarize yourself with the essential metrics.
- Step 3: Modify forecasts and assumptions in the editable yellow cells (WACC, growth, margins).
- Step 4: Instantly see recalculated results, including the intrinsic value of Gates Industrial Corporation plc (GTES).
- Step 5: Make well-informed investment decisions or create reports based on the outputs.
Why Choose This Calculator for Gates Industrial Corporation plc (GTES)?
- All-in-One Solution: Offers DCF, WACC, and financial ratio assessments all in one tool.
- Flexible Inputs: Modify the yellow-highlighted fields to explore different financial scenarios.
- In-Depth Analysis: Automatically calculates the intrinsic value and Net Present Value for Gates Industrial Corporation.
- Preloaded Information: Historical and projected data provide reliable starting figures.
- Expert-Level Tool: Perfect for financial analysts, investors, and business advisors.
Who Should Use This Product?
- Investors: Evaluate Gates Industrial Corporation's (GTES) market position before making investment decisions.
- CFOs and Financial Analysts: Enhance valuation methodologies and validate financial forecasts.
- Startup Founders: Gain insights into how established companies like Gates Industrial are assessed in the market.
- Consultants: Provide comprehensive valuation analyses for client projects.
- Students and Educators: Utilize current data to learn and teach valuation principles effectively.
What the Template Contains
- Historical Data: Includes Gates Industrial Corporation's past financials and baseline forecasts.
- DCF and Levered DCF Models: Detailed templates to calculate Gates Industrial Corporation's intrinsic value.
- WACC Sheet: Pre-built calculations for Weighted Average Cost of Capital.
- Editable Inputs: Modify key drivers like growth rates, EBITDA %, and CAPEX assumptions.
- Quarterly and Annual Statements: A complete breakdown of Gates Industrial Corporation's financials.
- Interactive Dashboard: Visualize valuation results and projections dynamically.
Disclaimer
All information, articles, and product details provided on this website are for general informational and educational purposes only. We do not claim any ownership over, nor do we intend to infringe upon, any trademarks, copyrights, logos, brand names, or other intellectual property mentioned or depicted on this site. Such intellectual property remains the property of its respective owners, and any references here are made solely for identification or informational purposes, without implying any affiliation, endorsement, or partnership.
We make no representations or warranties, express or implied, regarding the accuracy, completeness, or suitability of any content or products presented. Nothing on this website should be construed as legal, tax, investment, financial, medical, or other professional advice. In addition, no part of this site—including articles or product references—constitutes a solicitation, recommendation, endorsement, advertisement, or offer to buy or sell any securities, franchises, or other financial instruments, particularly in jurisdictions where such activity would be unlawful.
All content is of a general nature and may not address the specific circumstances of any individual or entity. It is not a substitute for professional advice or services. Any actions you take based on the information provided here are strictly at your own risk. You accept full responsibility for any decisions or outcomes arising from your use of this website and agree to release us from any liability in connection with your use of, or reliance upon, the content or products found herein.