
|
Harvard Bioscience, Inc. (HBIO) Avaliação DCF |
Totalmente Editável: Adapte-Se Às Suas Necessidades No Excel Ou Planilhas
Design Profissional: Modelos Confiáveis E Padrão Da Indústria
Pré-Construídos Para Uso Rápido E Eficiente
Compatível com MAC/PC, totalmente desbloqueado
Não É Necessária Experiência; Fácil De Seguir
Harvard Bioscience, Inc. (HBIO) Bundle
Avalie as perspectivas financeiras da Harvard Bioscience, Inc. (HBIO) como um especialista! Esta calculadora DCF (HBIO) fornece dados financeiros pré-preenchidos e total flexibilidade para modificar o crescimento da receita, WACC, margens e outras suposições críticas para se alinhar às suas projeções.
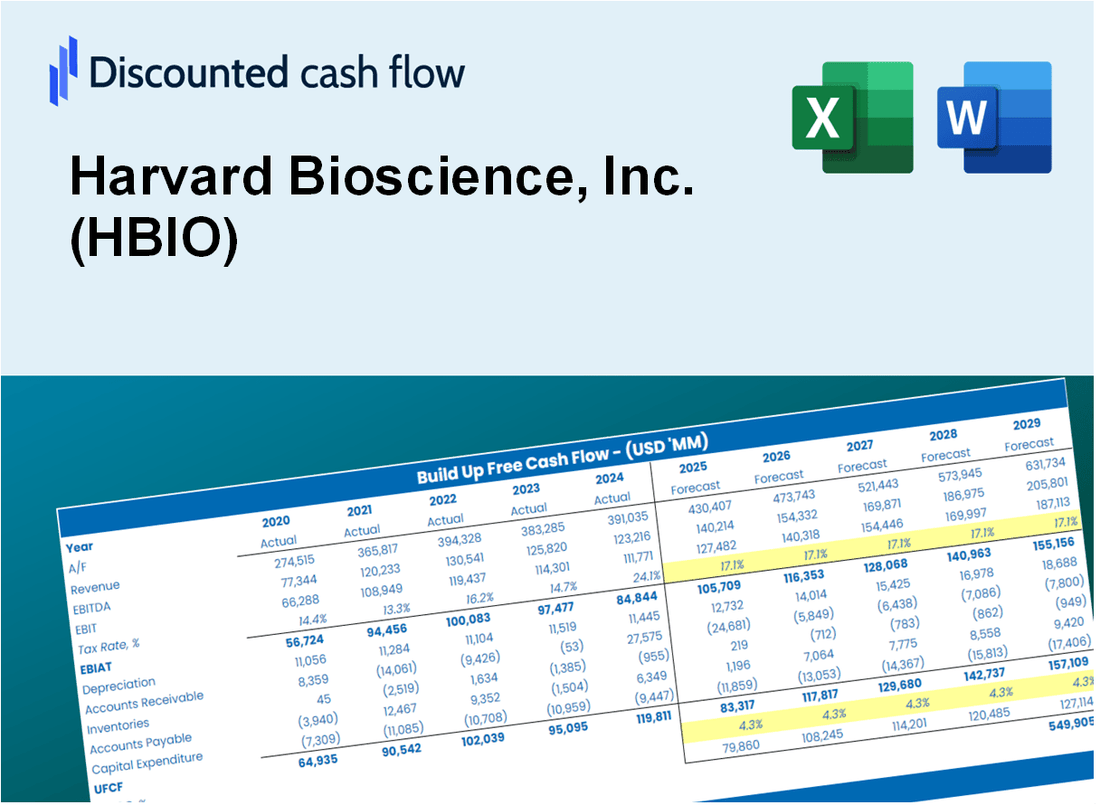
Discounted Cash Flow (DCF) - (USD MM)
| Year | AY1 2020 |
AY2 2021 |
AY3 2022 |
AY4 2023 |
AY5 2024 |
FY1 2025 |
FY2 2026 |
FY3 2027 |
FY4 2028 |
FY5 2029 |
|---|---|---|---|---|---|---|---|---|---|---|
| Revenue | 102.1 | 118.9 | 113.3 | 112.3 | 94.1 | 92.9 | 91.6 | 90.4 | 89.2 | 88.0 |
| Revenue Growth, % | 0 | 16.46 | -4.68 | -0.95734 | -16.14 | -1.33 | -1.33 | -1.33 | -1.33 | -1.33 |
| EBITDA | 5.2 | 9.0 | .9 | 8.0 | -1.5 | 3.5 | 3.5 | 3.4 | 3.4 | 3.4 |
| EBITDA, % | 5.06 | 7.59 | 0.83293 | 7.16 | -1.57 | 3.81 | 3.81 | 3.81 | 3.81 | 3.81 |
| Depreciation | 7.6 | 7.6 | 7.6 | 7.0 | 7.0 | 6.4 | 6.3 | 6.2 | 6.1 | 6.0 |
| Depreciation, % | 7.48 | 6.41 | 6.68 | 6.23 | 7.42 | 6.84 | 6.84 | 6.84 | 6.84 | 6.84 |
| EBIT | -2.5 | 1.4 | -6.6 | 1.0 | -8.5 | -2.8 | -2.8 | -2.7 | -2.7 | -2.7 |
| EBIT, % | -2.41 | 1.18 | -5.85 | 0.92205 | -8.98 | -3.03 | -3.03 | -3.03 | -3.03 | -3.03 |
| Total Cash | 8.3 | 7.8 | 4.5 | 4.3 | 4.1 | 5.0 | 4.9 | 4.9 | 4.8 | 4.7 |
| Total Cash, percent | .0 | .0 | .0 | .0 | .0 | .0 | .0 | .0 | .0 | .0 |
| Account Receivables | 17.8 | 21.8 | 16.7 | 16.1 | 14.9 | 15.0 | 14.8 | 14.6 | 14.4 | 14.2 |
| Account Receivables, % | 17.4 | 18.36 | 14.74 | 14.34 | 15.79 | 16.13 | 16.13 | 16.13 | 16.13 | 16.13 |
| Inventories | 22.3 | 27.6 | 26.4 | 24.7 | 23.2 | 21.4 | 21.1 | 20.8 | 20.5 | 20.3 |
| Inventories, % | 21.8 | 23.2 | 23.33 | 22.02 | 24.69 | 23.01 | 23.01 | 23.01 | 23.01 | 23.01 |
| Accounts Payable | 6.0 | 4.9 | 6.4 | 5.6 | 4.8 | 4.8 | 4.7 | 4.6 | 4.6 | 4.5 |
| Accounts Payable, % | 5.85 | 4.13 | 5.69 | 4.95 | 5.09 | 5.14 | 5.14 | 5.14 | 5.14 | 5.14 |
| Capital Expenditure | -1.2 | -1.3 | -1.6 | -2.3 | -3.3 | -1.7 | -1.7 | -1.7 | -1.6 | -1.6 |
| Capital Expenditure, % | -1.13 | -1.13 | -1.4 | -2.06 | -3.47 | -1.84 | -1.84 | -1.84 | -1.84 | -1.84 |
| Tax Rate, % | -6.34 | -6.34 | -6.34 | -6.34 | -6.34 | -6.34 | -6.34 | -6.34 | -6.34 | -6.34 |
| EBITAT | -2.6 | 2.9 | -6.9 | 1.4 | -9.0 | -2.8 | -2.8 | -2.7 | -2.7 | -2.7 |
| Depreciation | ||||||||||
| Changes in Account Receivables | ||||||||||
| Changes in Inventories | ||||||||||
| Changes in Accounts Payable | ||||||||||
| Capital Expenditure | ||||||||||
| UFCF | -30.2 | -1.3 | 6.9 | 7.5 | -3.3 | 3.6 | 2.2 | 2.2 | 2.2 | 2.1 |
| WACC, % | 8.78 | 8.78 | 8.78 | 8.78 | 8.78 | 8.78 | 8.78 | 8.78 | 8.78 | 8.78 |
| PV UFCF | ||||||||||
| SUM PV UFCF | 9.9 | |||||||||
| Long Term Growth Rate, % | 4.00 | |||||||||
| Free cash flow (T + 1) | 2 | |||||||||
| Terminal Value | 47 | |||||||||
| Present Terminal Value | 31 | |||||||||
| Enterprise Value | 40 | |||||||||
| Net Debt | 40 | |||||||||
| Equity Value | 0 | |||||||||
| Diluted Shares Outstanding, MM | 44 | |||||||||
| Equity Value Per Share | 0.00 |
What You Will Get
- Comprehensive HBIO Financials: Access to both historical and projected data for precise valuation.
- Customizable Inputs: Adjust WACC, tax rates, revenue growth, and capital expenditures to fit your analysis.
- Real-Time Calculations: Dynamic computation of intrinsic value and NPV at your fingertips.
- Scenario Analysis: Evaluate various scenarios to assess Harvard Bioscience's future performance.
- User-Friendly Interface: Designed for professionals while remaining approachable for newcomers.
Key Features
- Customizable Research Parameters: Adjust essential inputs such as revenue projections, R&D spending, and operational costs.
- Instant DCF Valuation: Quickly computes intrinsic value, NPV, and other financial metrics.
- Industry-Leading Precision: Leverages Harvard Bioscience's (HBIO) actual financial data for accurate valuation results.
- Effortless Scenario Testing: Evaluate various hypotheses and analyze results with ease.
- Efficiency Booster: Streamline the valuation process without the hassle of constructing intricate models from the ground up.
How It Functions
- Download the Template: Gain immediate access to the Excel-based HBIO DCF Calculator.
- Input Your Assumptions: Modify the yellow-highlighted cells for growth rates, WACC, margins, and additional parameters.
- Instant Calculations: The model automatically recalculates Harvard Bioscience’s intrinsic value.
- Test Scenarios: Experiment with various assumptions to assess potential changes in valuation.
- Analyze and Decide: Utilize the outcomes to inform your investment or financial analysis.
Why Choose This Calculator for Harvard Bioscience, Inc. (HBIO)?
- Designed for Experts: A sophisticated tool favored by researchers, lab managers, and financial analysts.
- Comprehensive Data: Historical and projected financials for Harvard Bioscience preloaded for precision.
- Flexible Scenario Analysis: Easily test various forecasts and assumptions to suit your needs.
- Insightful Results: Automatically computes intrinsic value, NPV, and essential metrics.
- User-Friendly: Clear, step-by-step instructions make navigation simple.
Who Should Use This Product?
- Life Science Researchers: Utilize advanced tools for experimental design and data analysis.
- Academics: Integrate cutting-edge technologies into teaching and research projects.
- Laboratory Managers: Optimize workflows and improve efficiency with our innovative solutions.
- Investors: Analyze market trends and performance metrics for Harvard Bioscience, Inc. (HBIO).
- Healthcare Professionals: Enhance diagnostic capabilities with state-of-the-art equipment and resources.
What the Template Contains
- Pre-Filled Data: Includes Harvard Bioscience’s historical financials and forecasts.
- Discounted Cash Flow Model: Editable DCF valuation model with automatic calculations.
- Weighted Average Cost of Capital (WACC): A dedicated sheet for calculating WACC based on custom inputs.
- Key Financial Ratios: Analyze Harvard Bioscience’s profitability, efficiency, and leverage.
- Customizable Inputs: Edit revenue growth, margins, and tax rates with ease.
- Clear Dashboard: Charts and tables summarizing key valuation results.
Disclaimer
All information, articles, and product details provided on this website are for general informational and educational purposes only. We do not claim any ownership over, nor do we intend to infringe upon, any trademarks, copyrights, logos, brand names, or other intellectual property mentioned or depicted on this site. Such intellectual property remains the property of its respective owners, and any references here are made solely for identification or informational purposes, without implying any affiliation, endorsement, or partnership.
We make no representations or warranties, express or implied, regarding the accuracy, completeness, or suitability of any content or products presented. Nothing on this website should be construed as legal, tax, investment, financial, medical, or other professional advice. In addition, no part of this site—including articles or product references—constitutes a solicitation, recommendation, endorsement, advertisement, or offer to buy or sell any securities, franchises, or other financial instruments, particularly in jurisdictions where such activity would be unlawful.
All content is of a general nature and may not address the specific circumstances of any individual or entity. It is not a substitute for professional advice or services. Any actions you take based on the information provided here are strictly at your own risk. You accept full responsibility for any decisions or outcomes arising from your use of this website and agree to release us from any liability in connection with your use of, or reliance upon, the content or products found herein.