
|
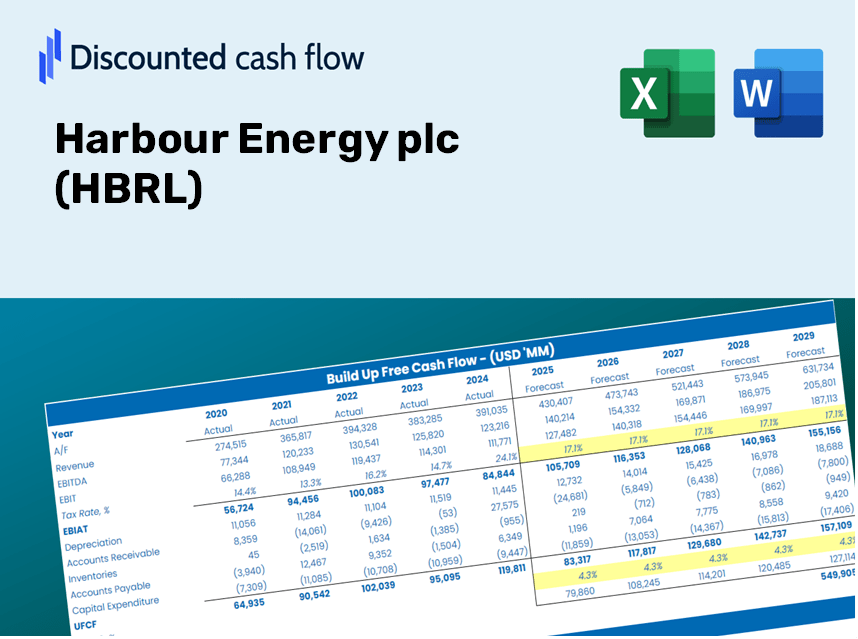
Avaliação DCF da Harbor Energy Plc (HB.L) |
Totalmente Editável: Adapte-Se Às Suas Necessidades No Excel Ou Planilhas
Design Profissional: Modelos Confiáveis E Padrão Da Indústria
Pré-Construídos Para Uso Rápido E Eficiente
Compatível com MAC/PC, totalmente desbloqueado
Não É Necessária Experiência; Fácil De Seguir
Harbour Energy plc (HBR.L) Bundle
Procurando determinar o valor intrínseco do Harbor Energy PLC? Nossa calculadora DCF (HBRL) integra dados do mundo real com extensos recursos de personalização, permitindo ajustar as previsões e fazer escolhas de investimento mais informadas.
Benefits You Will Receive
- Authentic HBRL Financial Data: Pre-populated with Harbour Energy’s historical and forecasted figures for accurate analysis.
- Customizable Template: Easily adjust vital inputs such as revenue growth, WACC, and EBITDA percentage.
- Instant Calculations: Watch the intrinsic value of Harbour Energy update in real-time as you make changes.
- Comprehensive Valuation Tool: Tailored for investors, analysts, and consultants who require precise DCF outcomes.
- Intuitive Design: Clear layout and straightforward instructions suitable for all levels of expertise.
Key Features
- Customizable Forecast Inputs: Adjust essential parameters such as revenue growth, EBITDA %, and capital expenditures for precise modeling.
- Instant DCF Valuation: Automatically computes intrinsic value, NPV, and other key metrics in real-time.
- Professional-Level Precision: Leverages Harbour Energy plc’s (HBRL) actual financial data for trustworthy valuation results.
- Simplified Scenario Analysis: Effortlessly test various assumptions and evaluate outcomes side-by-side.
- Efficiency-Boosting Tool: Streamline your process by eliminating the need to create intricate valuation models from the ground up.
How It Works
- Download: Obtain the pre-configured Excel file containing Harbour Energy plc’s (HBRL) financial data.
- Customize: Tailor your forecasts, including revenue growth, EBITDA %, and WACC.
- Update Automatically: Watch as the intrinsic value and NPV calculations refresh in real-time.
- Test Scenarios: Generate various projections and instantly compare the results.
- Make Decisions: Leverage the valuation outputs to inform your investment approach.
Why Opt for This Calculator?
- Precise Data: Authentic Harbour Energy financials provide trustworthy valuation outcomes.
- Flexible: Modify essential parameters such as growth rates, WACC, and tax rates to fit your forecasts.
- Time-Efficient: Ready-to-use calculations save you from having to start from the beginning.
- Professional Standard Tool: Tailored for investors, analysts, and consultants.
- Easy to Use: User-friendly design and clear, step-by-step guidance make it accessible for everyone.
Who Can Benefit from This Product?
- Investors: Evaluate Harbour Energy plc’s (HBRL) valuation prior to making stock transactions.
- CFOs and Financial Analysts: Optimize valuation procedures and assess financial projections.
- Startup Founders: Discover how established firms like Harbour Energy are valued in the market.
- Consultants: Create comprehensive valuation reports for your clients.
- Students and Educators: Utilize real data to practice and instruct on valuation methodologies.
Contents of the Template
- Historical Data: Contains Harbour Energy plc's (HBRL) previous financials and foundational forecasts.
- DCF and Levered DCF Models: Comprehensive templates for assessing the intrinsic value of Harbour Energy plc (HBRL).
- WACC Sheet: Pre-calculated metrics for the Weighted Average Cost of Capital.
- Editable Inputs: Adjust essential parameters such as growth rates, EBITDA percentages, and CAPEX assumptions.
- Quarterly and Annual Statements: An in-depth analysis of Harbour Energy plc's (HBRL) financials.
- Interactive Dashboard: Visualize valuation outcomes and forecasts in an engaging way.
Disclaimer
All information, articles, and product details provided on this website are for general informational and educational purposes only. We do not claim any ownership over, nor do we intend to infringe upon, any trademarks, copyrights, logos, brand names, or other intellectual property mentioned or depicted on this site. Such intellectual property remains the property of its respective owners, and any references here are made solely for identification or informational purposes, without implying any affiliation, endorsement, or partnership.
We make no representations or warranties, express or implied, regarding the accuracy, completeness, or suitability of any content or products presented. Nothing on this website should be construed as legal, tax, investment, financial, medical, or other professional advice. In addition, no part of this site—including articles or product references—constitutes a solicitation, recommendation, endorsement, advertisement, or offer to buy or sell any securities, franchises, or other financial instruments, particularly in jurisdictions where such activity would be unlawful.
All content is of a general nature and may not address the specific circumstances of any individual or entity. It is not a substitute for professional advice or services. Any actions you take based on the information provided here are strictly at your own risk. You accept full responsibility for any decisions or outcomes arising from your use of this website and agree to release us from any liability in connection with your use of, or reliance upon, the content or products found herein.