
|
HealthCare Global Enterprises Limited (HCG.NS) Avaliação DCF |
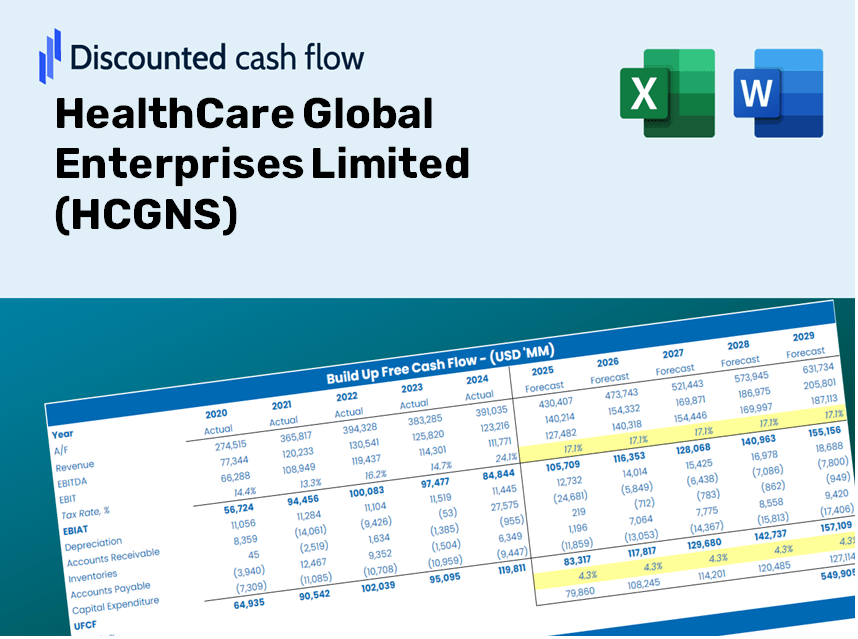
Totalmente Editável: Adapte-Se Às Suas Necessidades No Excel Ou Planilhas
Design Profissional: Modelos Confiáveis E Padrão Da Indústria
Pré-Construídos Para Uso Rápido E Eficiente
Compatível com MAC/PC, totalmente desbloqueado
Não É Necessária Experiência; Fácil De Seguir
HealthCare Global Enterprises Limited (HCG.NS) Bundle
Projetado para precisão, nossa calculadora DCF (HCGNS) capacita a avaliação da HealthCare Global Enterprises Limited usando informações financeiras atualizadas e oferece flexibilidade completa para modificar parâmetros essenciais para projeções aprimoradas.
Discounted Cash Flow (DCF) - (USD MM)
| Year | AY1 2021 |
AY2 2022 |
AY3 2023 |
AY4 2024 |
AY5 2025 |
FY1 2026 |
FY2 2027 |
FY3 2028 |
FY4 2029 |
FY5 2030 |
|---|---|---|---|---|---|---|---|---|---|---|
| Revenue | 10,134.4 | 13,977.8 | 16,944.5 | 19,121.2 | 22,228.5 | 27,132.4 | 33,118.3 | 40,424.6 | 49,342.9 | 60,228.7 |
| Revenue Growth, % | 0 | 37.93 | 21.22 | 12.85 | 16.25 | 22.06 | 22.06 | 22.06 | 22.06 | 22.06 |
| EBITDA | 656.2 | 1,784.1 | 2,372.4 | 2,671.3 | 3,129.4 | 3,325.8 | 4,059.6 | 4,955.2 | 6,048.4 | 7,382.7 |
| EBITDA, % | 6.48 | 12.76 | 14 | 13.97 | 14.08 | 12.26 | 12.26 | 12.26 | 12.26 | 12.26 |
| Depreciation | 990.0 | 988.7 | 1,017.2 | 1,116.4 | 1,349.8 | 1,886.0 | 2,302.1 | 2,810.0 | 3,429.9 | 4,186.6 |
| Depreciation, % | 9.77 | 7.07 | 6 | 5.84 | 6.07 | 6.95 | 6.95 | 6.95 | 6.95 | 6.95 |
| EBIT | -333.7 | 795.5 | 1,355.3 | 1,554.9 | 1,779.5 | 1,439.8 | 1,757.5 | 2,145.2 | 2,618.4 | 3,196.1 |
| EBIT, % | -3.29 | 5.69 | 8 | 8.13 | 8.01 | 5.31 | 5.31 | 5.31 | 5.31 | 5.31 |
| Total Cash | 1,657.3 | 2,041.5 | 1,966.4 | 3,030.7 | 3,526.8 | 4,030.8 | 4,920.0 | 6,005.5 | 7,330.4 | 8,947.6 |
| Total Cash, percent | .0 | .0 | .0 | .0 | .0 | .0 | .0 | .0 | .0 | .0 |
| Account Receivables | 2,017.9 | 2,399.2 | 3,025.1 | 2,947.3 | 4,036.0 | 4,802.4 | 5,861.9 | 7,155.1 | 8,733.6 | 10,660.4 |
| Account Receivables, % | 19.91 | 17.16 | 17.85 | 15.41 | 18.16 | 17.7 | 17.7 | 17.7 | 17.7 | 17.7 |
| Inventories | 211.1 | 299.7 | 382.9 | 426.7 | 530.2 | 602.5 | 735.4 | 897.7 | 1,095.7 | 1,337.5 |
| Inventories, % | 2.08 | 2.14 | 2.26 | 2.23 | 2.39 | 2.22 | 2.22 | 2.22 | 2.22 | 2.22 |
| Accounts Payable | 1,455.2 | 1,939.4 | 2,484.5 | 2,810.7 | 3,342.6 | 3,941.4 | 4,811.0 | 5,872.4 | 7,167.9 | 8,749.2 |
| Accounts Payable, % | 14.36 | 13.87 | 14.66 | 14.7 | 15.04 | 14.53 | 14.53 | 14.53 | 14.53 | 14.53 |
| Capital Expenditure | -354.2 | -712.3 | -1,332.4 | -1,856.8 | -2,088.7 | -1,929.8 | -2,355.5 | -2,875.2 | -3,509.5 | -4,283.7 |
| Capital Expenditure, % | -3.5 | -5.1 | -7.86 | -9.71 | -9.4 | -7.11 | -7.11 | -7.11 | -7.11 | -7.11 |
| Tax Rate, % | 22.04 | 22.04 | 22.04 | 22.04 | 22.04 | 22.04 | 22.04 | 22.04 | 22.04 | 22.04 |
| EBITAT | -282.4 | 487.0 | 886.3 | 1,105.5 | 1,387.4 | 1,037.5 | 1,266.4 | 1,545.7 | 1,886.7 | 2,303.0 |
| Depreciation | ||||||||||
| Changes in Account Receivables | ||||||||||
| Changes in Inventories | ||||||||||
| Changes in Accounts Payable | ||||||||||
| Capital Expenditure | ||||||||||
| UFCF | -420.4 | 777.6 | 407.1 | 725.3 | -11.8 | 753.9 | 890.1 | 1,086.5 | 1,326.2 | 1,618.7 |
| WACC, % | 4.92 | 4.63 | 4.68 | 4.75 | 4.84 | 4.76 | 4.76 | 4.76 | 4.76 | 4.76 |
| PV UFCF | ||||||||||
| SUM PV UFCF | 4,859.0 | |||||||||
| Long Term Growth Rate, % | 4.00 | |||||||||
| Free cash flow (T + 1) | 1,683 | |||||||||
| Terminal Value | 220,392 | |||||||||
| Present Terminal Value | 174,638 | |||||||||
| Enterprise Value | 179,497 | |||||||||
| Net Debt | 16,014 | |||||||||
| Equity Value | 163,484 | |||||||||
| Diluted Shares Outstanding, MM | 141 | |||||||||
| Equity Value Per Share | 1,155.91 |
What You Will Gain
- Authentic HCGNS Data: Preloaded financials – including revenue and EBIT – derived from actual and projected figures.
- Comprehensive Customization: Modify all essential parameters (highlighted cells) such as WACC, growth %, and tax rates.
- Real-time Valuation Adjustments: Automatic recalculations to assess the impact of changes on HCGNS’s fair value.
- Flexible Excel Template: Designed for easy edits, scenario analysis, and in-depth projections.
- Efficient and Precise: Avoid starting from scratch while ensuring accuracy and adaptability.
Key Features of HealthCare Global Enterprises Limited (HCGNS)
- Comprehensive Financial Data: Access reliable pre-loaded historical performance metrics and future forecasts.
- Tailorable Forecast Assumptions: Modify highlighted cells for parameters such as WACC, growth rates, and profit margins.
- Real-time Calculations: Automatic adjustments for Discounted Cash Flow (DCF), Net Present Value (NPV), and cash flow assessments.
- User-Friendly Dashboard: Easy-to-interpret charts and summaries to help you visualize your valuation outcomes.
- Designed for All Skill Levels: An intuitive layout suited for investors, CFOs, and consultants alike.
How It Works
- Step 1: Download the Excel file for HealthCare Global Enterprises Limited (HCGNS).
- Step 2: Examine the pre-filled financial data and forecasts provided for HCGNS.
- Step 3: Adjust essential inputs such as revenue growth, WACC, and tax rates (highlighted cells).
- Step 4: Observe the DCF model refresh in real-time as you modify your assumptions.
- Step 5: Evaluate the outputs to inform your investment decisions regarding HealthCare Global Enterprises Limited (HCGNS).
Why Choose This Calculator for HealthCare Global Enterprises Limited (HCGNS)?
- Reliable Data: Authentic financials from HCGNS provide trustworthy valuation outcomes.
- Adjustable Features: Tailor essential inputs like growth rates, WACC, and tax rates to align with your forecasts.
- Efficient: Pre-configured calculations save you from starting with a blank slate.
- Expert-Quality Tool: Crafted for use by investors, analysts, and consultants in the healthcare sector.
- Accessible Interface: User-friendly design and clear, guided instructions cater to all users.
Who Can Benefit from This Product?
- Healthcare Students: Master valuation methodologies and apply them using actual healthcare data.
- Researchers: Integrate industry-standard models into your studies or academic projects.
- Investors: Evaluate your investment strategies and analyze valuation scenarios for HealthCare Global Enterprises Limited (HCGNS).
- Financial Analysts: Enhance your analysis process with a customizable DCF model tailored for the healthcare sector.
- Healthcare Business Owners: Discover how major publicly traded healthcare companies like HealthCare Global Enterprises Limited (HCGNS) are evaluated.
Contents of the Template
- Comprehensive DCF Model: An editable template featuring detailed valuation calculations tailored for HealthCare Global Enterprises Limited (HCGNS).
- Real-World Data: Historical and projected financials for HCGNS are preloaded, ready for in-depth analysis.
- Customizable Parameters: Modify WACC, growth rates, and tax assumptions to explore various scenarios.
- Financial Statements: Complete annual and quarterly financial breakdowns for enhanced insights.
- Key Ratios: Integrated analysis of profitability, efficiency, and leverage ratios.
- Dashboard with Visual Outputs: Visuals including charts and tables to provide clear, actionable results.
Disclaimer
All information, articles, and product details provided on this website are for general informational and educational purposes only. We do not claim any ownership over, nor do we intend to infringe upon, any trademarks, copyrights, logos, brand names, or other intellectual property mentioned or depicted on this site. Such intellectual property remains the property of its respective owners, and any references here are made solely for identification or informational purposes, without implying any affiliation, endorsement, or partnership.
We make no representations or warranties, express or implied, regarding the accuracy, completeness, or suitability of any content or products presented. Nothing on this website should be construed as legal, tax, investment, financial, medical, or other professional advice. In addition, no part of this site—including articles or product references—constitutes a solicitation, recommendation, endorsement, advertisement, or offer to buy or sell any securities, franchises, or other financial instruments, particularly in jurisdictions where such activity would be unlawful.
All content is of a general nature and may not address the specific circumstances of any individual or entity. It is not a substitute for professional advice or services. Any actions you take based on the information provided here are strictly at your own risk. You accept full responsibility for any decisions or outcomes arising from your use of this website and agree to release us from any liability in connection with your use of, or reliance upon, the content or products found herein.