
|
Healthcare Triangle, Inc. (HCTI) Avaliação DCF |
Totalmente Editável: Adapte-Se Às Suas Necessidades No Excel Ou Planilhas
Design Profissional: Modelos Confiáveis E Padrão Da Indústria
Pré-Construídos Para Uso Rápido E Eficiente
Compatível com MAC/PC, totalmente desbloqueado
Não É Necessária Experiência; Fácil De Seguir
Healthcare Triangle, Inc. (HCTI) Bundle
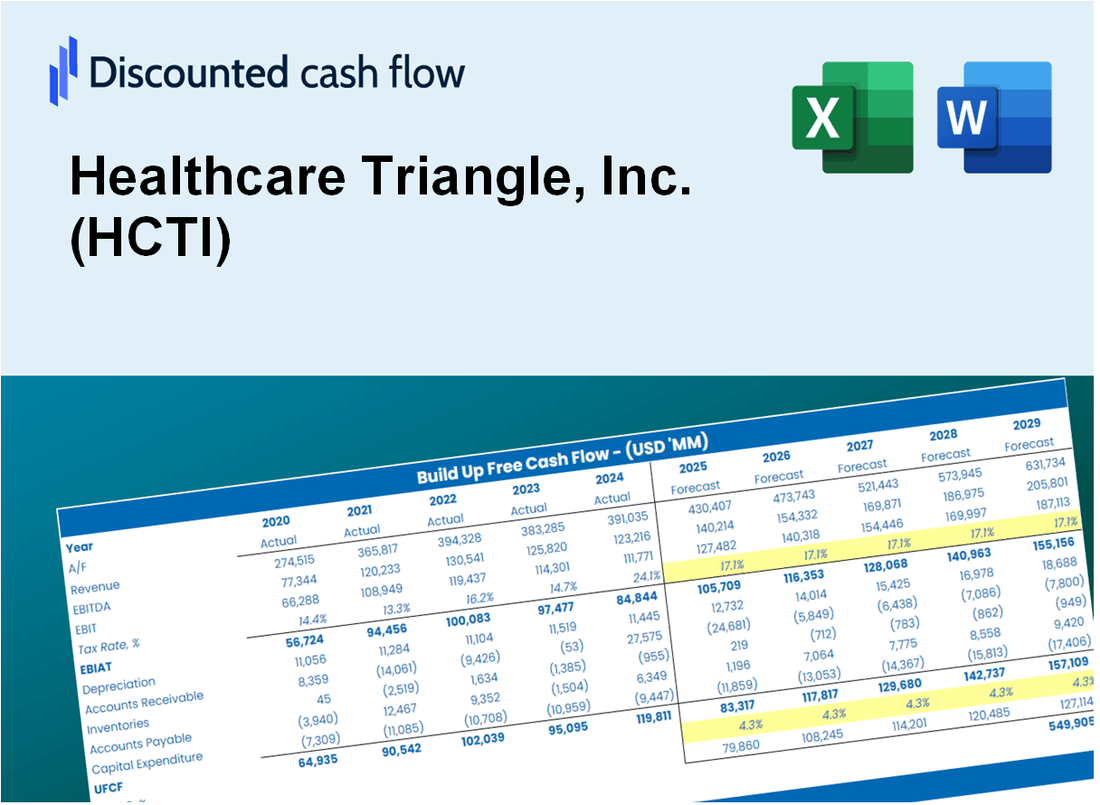
Descubra o verdadeiro valor do Healthcare Triangle, Inc. (HCTI) com nossa calculadora DCF avançada! Ajuste as principais premissas, explore vários cenários e examine como diferentes fatores afetam a avaliação do Healthcare Triangle, Inc. (HCTI) - tudo dentro de um modelo abrangente do Excel.
What You Will Get
- Editable Excel Template: A fully customizable Excel-based DCF Calculator featuring pre-filled real HCTI financials.
- Real-World Data: Historical data and forward-looking estimates (as indicated in the yellow cells).
- Forecast Flexibility: Modify forecast assumptions such as revenue growth, EBITDA %, and WACC.
- Automatic Calculations: Instantly observe the impact of your inputs on Healthcare Triangle's valuation.
- Professional Tool: Designed for investors, CFOs, consultants, and financial analysts.
- User-Friendly Design: Organized for clarity and ease of use, complete with step-by-step instructions.
Key Features
- 🔍 Real-Life HCTI Financials: Pre-filled historical and projected data for Healthcare Triangle, Inc. (HCTI).
- ✏️ Fully Customizable Inputs: Adjust all critical parameters (yellow cells) like WACC, growth %, and tax rates.
- 📊 Professional DCF Valuation: Built-in formulas calculate HCTI’s intrinsic value using the Discounted Cash Flow method.
- ⚡ Instant Results: Visualize HCTI’s valuation instantly after making changes.
- Scenario Analysis: Test and compare outcomes for various financial assumptions side-by-side.
How It Works
- Download: Obtain the pre-formatted Excel file featuring Healthcare Triangle, Inc.'s (HCTI) financial metrics.
- Customize: Modify projections such as revenue growth, EBITDA %, and WACC to fit your analysis.
- Update Automatically: Watch as intrinsic value and NPV calculations refresh in real-time.
- Test Scenarios: Develop various forecasts and evaluate results immediately.
- Make Decisions: Leverage the valuation data to inform your investment choices.
Why Choose This Calculator?
- Designed for Healthcare Experts: An advanced tool utilized by healthcare analysts, CFOs, and consultants.
- Accurate Data: Healthcare Triangle, Inc.'s (HCTI) historical and projected financials are preloaded for precision.
- Flexible Scenario Analysis: Effortlessly simulate various forecasts and assumptions.
- Comprehensive Outputs: Automatically computes intrinsic value, NPV, and essential metrics.
- User-Friendly: Step-by-step guidance ensures a smooth experience throughout the process.
Who Should Use This Product?
- Healthcare Professionals: Develop comprehensive and accurate financial models for healthcare investments.
- Corporate Finance Teams: Evaluate valuation scenarios to inform strategic decisions within healthcare organizations.
- Consultants and Advisors: Deliver precise valuation insights for Healthcare Triangle, Inc. (HCTI) to clients.
- Students and Educators: Utilize real-world healthcare data to enhance learning in financial modeling.
- Investors and Analysts: Gain a deeper understanding of how healthcare companies like Healthcare Triangle, Inc. (HCTI) are valued in the market.
What the Template Contains
- Operating and Balance Sheet Data: Pre-filled Healthcare Triangle, Inc. (HCTI) historical data and forecasts, including revenue, EBITDA, EBIT, and capital expenditures.
- WACC Calculation: A dedicated sheet for Weighted Average Cost of Capital (WACC), including parameters like Beta, risk-free rate, and share price.
- DCF Valuation (Unlevered and Levered): Editable Discounted Cash Flow models showing intrinsic value with detailed calculations.
- Financial Statements: Pre-loaded financial statements (annual and quarterly) to support analysis.
- Key Ratios: Includes profitability, leverage, and efficiency ratios for Healthcare Triangle, Inc. (HCTI).
- Dashboard and Charts: Visual summary of valuation outputs and assumptions to analyze results easily.
Disclaimer
All information, articles, and product details provided on this website are for general informational and educational purposes only. We do not claim any ownership over, nor do we intend to infringe upon, any trademarks, copyrights, logos, brand names, or other intellectual property mentioned or depicted on this site. Such intellectual property remains the property of its respective owners, and any references here are made solely for identification or informational purposes, without implying any affiliation, endorsement, or partnership.
We make no representations or warranties, express or implied, regarding the accuracy, completeness, or suitability of any content or products presented. Nothing on this website should be construed as legal, tax, investment, financial, medical, or other professional advice. In addition, no part of this site—including articles or product references—constitutes a solicitation, recommendation, endorsement, advertisement, or offer to buy or sell any securities, franchises, or other financial instruments, particularly in jurisdictions where such activity would be unlawful.
All content is of a general nature and may not address the specific circumstances of any individual or entity. It is not a substitute for professional advice or services. Any actions you take based on the information provided here are strictly at your own risk. You accept full responsibility for any decisions or outcomes arising from your use of this website and agree to release us from any liability in connection with your use of, or reliance upon, the content or products found herein.