
|
HF Foods Group Inc. (HFFG) Avaliação DCF |
Totalmente Editável: Adapte-Se Às Suas Necessidades No Excel Ou Planilhas
Design Profissional: Modelos Confiáveis E Padrão Da Indústria
Pré-Construídos Para Uso Rápido E Eficiente
Compatível com MAC/PC, totalmente desbloqueado
Não É Necessária Experiência; Fácil De Seguir
HF Foods Group Inc. (HFFG) Bundle
Simplifique sua análise e melhore a precisão com a nossa calculadora DCF (HFFG)! Utilizando dados reais do HF Foods Group Inc. e suposições personalizáveis, essa ferramenta o capacita a prever, analisar e valorizar (HFFG) como um investidor experiente.
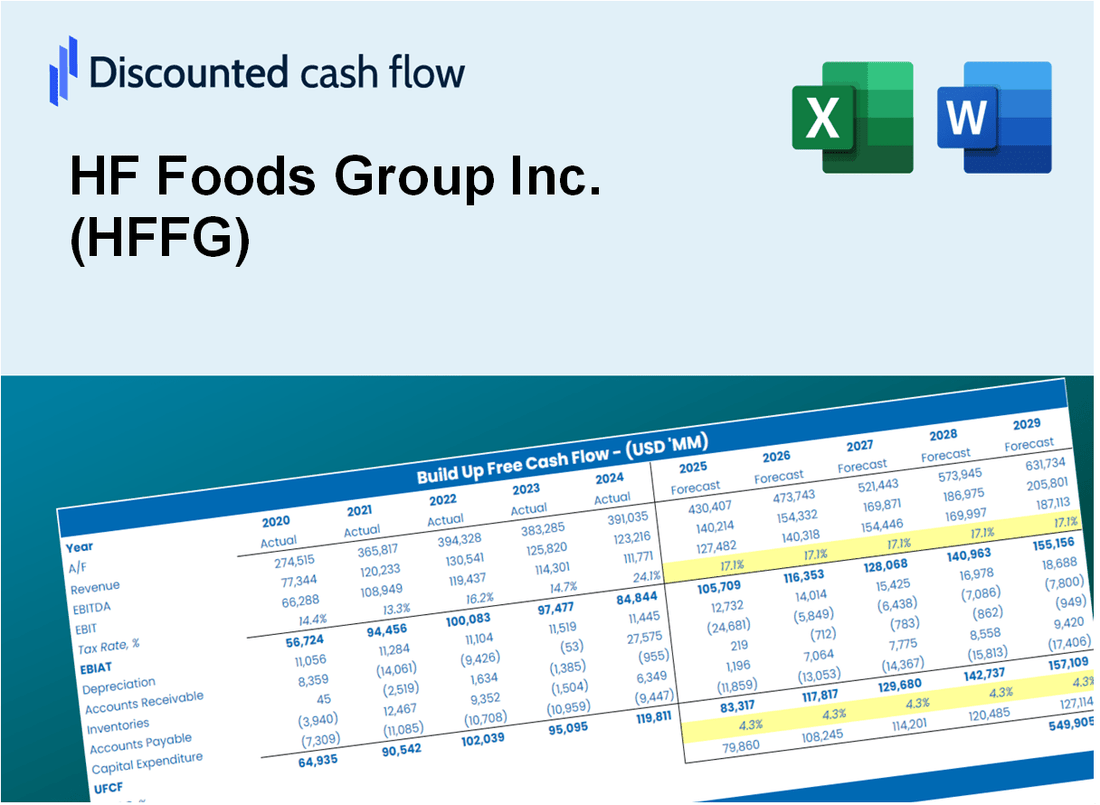
Discounted Cash Flow (DCF) - (USD MM)
| Year | AY1 2020 |
AY2 2021 |
AY3 2022 |
AY4 2023 |
AY5 2024 |
FY1 2025 |
FY2 2026 |
FY3 2027 |
FY4 2028 |
FY5 2029 |
|---|---|---|---|---|---|---|---|---|---|---|
| Revenue | 566.8 | 796.9 | 1,170.5 | 1,148.5 | 1,201.7 | 1,269.6 | 1,341.4 | 1,417.3 | 1,497.4 | 1,582.1 |
| Revenue Growth, % | 0 | 40.59 | 46.88 | -1.88 | 4.63 | 5.65 | 5.65 | 5.65 | 5.65 | 5.65 |
| EBITDA | -324.7 | 52.8 | 32.4 | 34.8 | -8.0 | -115.6 | -122.1 | -129.0 | -136.3 | -144.1 |
| EBITDA, % | -57.28 | 6.63 | 2.77 | 3.03 | -0.66865 | -9.11 | -9.11 | -9.11 | -9.11 | -9.11 |
| Depreciation | 18.9 | 21.4 | 24.9 | 25.9 | 26.7 | 32.1 | 33.9 | 35.8 | 37.8 | 40.0 |
| Depreciation, % | 3.34 | 2.69 | 2.13 | 2.26 | 2.22 | 2.53 | 2.53 | 2.53 | 2.53 | 2.53 |
| EBIT | -343.6 | 31.4 | 7.5 | 8.9 | -34.7 | -147.7 | -156.0 | -164.9 | -174.2 | -184.0 |
| EBIT, % | -60.62 | 3.94 | 0.63744 | 0.77118 | -2.89 | -11.63 | -11.63 | -11.63 | -11.63 | -11.63 |
| Total Cash | 9.6 | 14.8 | 24.3 | 15.2 | 14.5 | 20.7 | 21.9 | 23.1 | 24.4 | 25.8 |
| Total Cash, percent | .0 | .0 | .0 | .0 | .0 | .0 | .0 | .0 | .0 | .0 |
| Account Receivables | 26.1 | 36.5 | 44.4 | 47.8 | 54.3 | 55.0 | 58.1 | 61.4 | 64.9 | 68.6 |
| Account Receivables, % | 4.61 | 4.58 | 3.79 | 4.16 | 4.52 | 4.33 | 4.33 | 4.33 | 4.33 | 4.33 |
| Inventories | 58.5 | 102.7 | 120.3 | 105.6 | 97.8 | 129.1 | 136.4 | 144.1 | 152.2 | 160.8 |
| Inventories, % | 10.33 | 12.89 | 10.28 | 9.2 | 8.14 | 10.16 | 10.16 | 10.16 | 10.16 | 10.16 |
| Accounts Payable | 29.6 | 57.7 | 55.5 | 51.6 | 50.6 | 65.8 | 69.5 | 73.5 | 77.6 | 82.0 |
| Accounts Payable, % | 5.23 | 7.25 | 4.74 | 4.49 | 4.21 | 5.18 | 5.18 | 5.18 | 5.18 | 5.18 |
| Capital Expenditure | -.7 | -2.2 | -6.3 | -3.5 | -12.5 | -5.8 | -6.1 | -6.5 | -6.8 | -7.2 |
| Capital Expenditure, % | -0.11714 | -0.2767 | -0.53714 | -0.30597 | -1.04 | -0.45622 | -0.45622 | -0.45622 | -0.45622 | -0.45622 |
| Tax Rate, % | -5.15 | -5.15 | -5.15 | -5.15 | -5.15 | -5.15 | -5.15 | -5.15 | -5.15 | -5.15 |
| EBITAT | -339.2 | 25.5 | 858.0 | 7.3 | -36.5 | -136.7 | -144.4 | -152.6 | -161.2 | -170.3 |
| Depreciation | ||||||||||
| Changes in Account Receivables | ||||||||||
| Changes in Inventories | ||||||||||
| Changes in Accounts Payable | ||||||||||
| Capital Expenditure | ||||||||||
| UFCF | -376.0 | 18.2 | 849.0 | 37.1 | -22.1 | -127.1 | -123.3 | -130.3 | -137.7 | -145.4 |
| WACC, % | 5.48 | 4.87 | 5.53 | 4.93 | 5.53 | 5.27 | 5.27 | 5.27 | 5.27 | 5.27 |
| PV UFCF | ||||||||||
| SUM PV UFCF | -568.3 | |||||||||
| Long Term Growth Rate, % | 2.00 | |||||||||
| Free cash flow (T + 1) | -148 | |||||||||
| Terminal Value | -4,540 | |||||||||
| Present Terminal Value | -3,512 | |||||||||
| Enterprise Value | -4,080 | |||||||||
| Net Debt | 195 | |||||||||
| Equity Value | -4,276 | |||||||||
| Diluted Shares Outstanding, MM | 53 | |||||||||
| Equity Value Per Share | -81.36 |
What You Will Get
- Real HFFG Financial Data: Pre-filled with HF Foods Group Inc.’s historical and projected data for precise analysis.
- Fully Editable Template: Modify key inputs like revenue growth, WACC, and EBITDA % with ease.
- Automatic Calculations: See HF Foods Group Inc.’s intrinsic value update instantly based on your changes.
- Professional Valuation Tool: Designed for investors, analysts, and consultants seeking accurate DCF results.
- User-Friendly Design: Simple structure and clear instructions for all experience levels.
Key Features
- Customizable Financial Inputs: Adjust vital metrics such as sales growth, operating margin, and capital investment.
- Instant DCF Valuation: Quickly computes intrinsic value, NPV, and other financial metrics.
- High-Precision Results: Leverages HF Foods Group Inc.’s (HFFG) actual financial data for accurate valuation results.
- Effortless Scenario Simulation: Easily explore various assumptions and analyze resulting impacts.
- Efficiency Booster: Avoid the hassle of creating intricate valuation models from the ground up.
How It Works
- Step 1: Download the Excel file for HF Foods Group Inc. (HFFG).
- Step 2: Review the pre-filled financial data and forecasts for HF Foods Group Inc. (HFFG).
- Step 3: Adjust key inputs such as revenue growth, WACC, and tax rates (highlighted cells).
- Step 4: Observe the DCF model update in real-time as you modify your assumptions.
- Step 5: Evaluate the outputs and leverage the results for your investment strategies.
Why Choose This Calculator for HF Foods Group Inc. (HFFG)?
- Accurate Data: Utilize real HF Foods Group financials for dependable valuation outcomes.
- Customizable: Tailor essential parameters such as growth rates, WACC, and tax rates to align with your forecasts.
- Time-Saving: Pre-configured calculations save you the hassle of starting from the ground up.
- Professional-Grade Tool: Crafted for investors, analysts, and consultants in the food industry.
- User-Friendly: With an intuitive design and clear instructions, it's accessible for all users.
Who Should Use This Product?
- Investors: Accurately estimate HF Foods Group Inc.'s (HFFG) fair value before making investment decisions.
- CFOs: Utilize a professional-grade DCF model for financial reporting and analysis specific to HF Foods Group Inc. (HFFG).
- Consultants: Quickly adapt the template for valuation reports tailored to HF Foods Group Inc. (HFFG) clients.
- Entrepreneurs: Gain insights into financial modeling practices employed by leading companies like HF Foods Group Inc. (HFFG).
- Educators: Use it as a teaching tool to illustrate valuation methodologies relevant to HF Foods Group Inc. (HFFG).
What the Template Contains
- Operating and Balance Sheet Data: Pre-filled HF Foods Group Inc. (HFFG) historical data and forecasts, including revenue, EBITDA, EBIT, and capital expenditures.
- WACC Calculation: A dedicated sheet for Weighted Average Cost of Capital (WACC), including parameters like Beta, risk-free rate, and share price.
- DCF Valuation (Unlevered and Levered): Editable Discounted Cash Flow models showing intrinsic value with detailed calculations.
- Financial Statements: Pre-loaded financial statements (annual and quarterly) to support analysis.
- Key Ratios: Includes profitability, leverage, and efficiency ratios for HF Foods Group Inc. (HFFG).
- Dashboard and Charts: Visual summary of valuation outputs and assumptions to analyze results easily.
Disclaimer
All information, articles, and product details provided on this website are for general informational and educational purposes only. We do not claim any ownership over, nor do we intend to infringe upon, any trademarks, copyrights, logos, brand names, or other intellectual property mentioned or depicted on this site. Such intellectual property remains the property of its respective owners, and any references here are made solely for identification or informational purposes, without implying any affiliation, endorsement, or partnership.
We make no representations or warranties, express or implied, regarding the accuracy, completeness, or suitability of any content or products presented. Nothing on this website should be construed as legal, tax, investment, financial, medical, or other professional advice. In addition, no part of this site—including articles or product references—constitutes a solicitation, recommendation, endorsement, advertisement, or offer to buy or sell any securities, franchises, or other financial instruments, particularly in jurisdictions where such activity would be unlawful.
All content is of a general nature and may not address the specific circumstances of any individual or entity. It is not a substitute for professional advice or services. Any actions you take based on the information provided here are strictly at your own risk. You accept full responsibility for any decisions or outcomes arising from your use of this website and agree to release us from any liability in connection with your use of, or reliance upon, the content or products found herein.