
|
Hindustan Unilever Limited (Hindunilvr.ns) Avaliação DCF |
Totalmente Editável: Adapte-Se Às Suas Necessidades No Excel Ou Planilhas
Design Profissional: Modelos Confiáveis E Padrão Da Indústria
Pré-Construídos Para Uso Rápido E Eficiente
Compatível com MAC/PC, totalmente desbloqueado
Não É Necessária Experiência; Fácil De Seguir
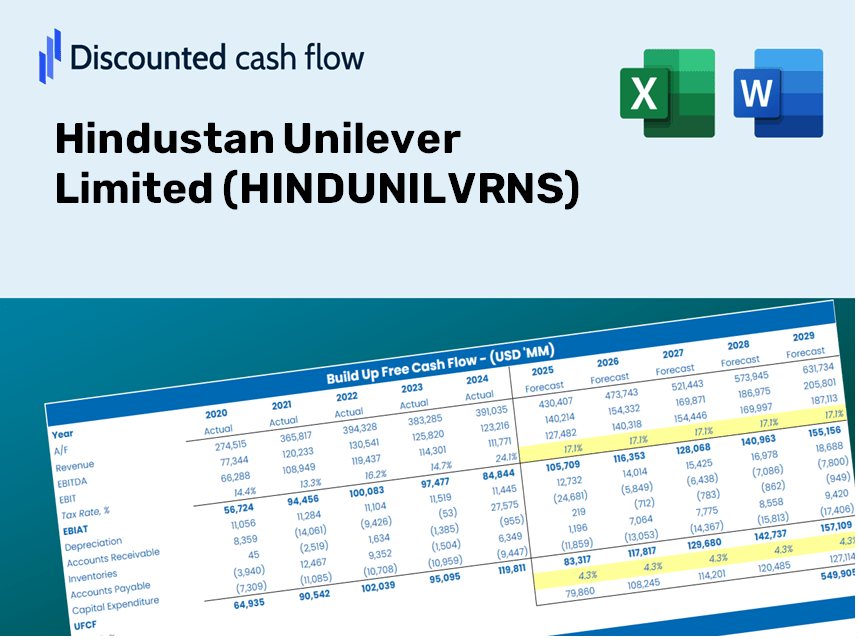
Hindustan Unilever Limited (HINDUNILVR.NS) Bundle
Descubra o verdadeiro valor da Hindustan Unilever Limited (Hindunilvrns) com nossa calculadora DCF avançada! Ajuste as principais suposições, explore vários cenários e avalie como diferentes mudanças afetam a avaliação Hindustan Unilever Limited (Hindunilvrns) - tudo dentro de um modelo abrangente do Excel.
Discounted Cash Flow (DCF) - (USD MM)
| Year | AY1 2021 |
AY2 2022 |
AY3 2023 |
AY4 2024 |
AY5 2025 |
FY1 2026 |
FY2 2027 |
FY3 2028 |
FY4 2029 |
FY5 2030 |
|---|---|---|---|---|---|---|---|---|---|---|
| Revenue | 469,200.0 | 523,060.0 | 604,010.0 | 617,250.0 | 628,810.0 | 677,574.5 | 730,120.7 | 786,741.9 | 847,754.2 | 913,497.9 |
| Revenue Growth, % | 0 | 11.48 | 15.48 | 2.19 | 1.87 | 7.76 | 7.76 | 7.76 | 7.76 | 7.76 |
| EBITDA | 117,680.0 | 130,470.0 | 145,710.0 | 152,560.0 | 159,080.0 | 168,259.4 | 181,308.0 | 195,368.5 | 210,519.4 | 226,845.3 |
| EBITDA, % | 25.08 | 24.94 | 24.12 | 24.72 | 25.3 | 24.83 | 24.83 | 24.83 | 24.83 | 24.83 |
| Depreciation | 10,740.0 | 10,910.0 | 11,370.0 | 12,160.0 | 13,550.0 | 14,069.3 | 15,160.4 | 16,336.1 | 17,603.0 | 18,968.1 |
| Depreciation, % | 2.29 | 2.09 | 1.88 | 1.97 | 2.15 | 2.08 | 2.08 | 2.08 | 2.08 | 2.08 |
| EBIT | 106,940.0 | 119,560.0 | 134,340.0 | 140,400.0 | 145,530.0 | 154,190.1 | 166,147.6 | 179,032.4 | 192,916.5 | 207,877.2 |
| EBIT, % | 22.79 | 22.86 | 22.24 | 22.75 | 23.14 | 22.76 | 22.76 | 22.76 | 22.76 | 22.76 |
| Total Cash | 78,420.0 | 78,040.0 | 88,750.0 | 135,420.0 | 127,930.0 | 120,081.0 | 129,393.4 | 139,427.9 | 150,240.6 | 161,891.8 |
| Total Cash, percent | .0 | .0 | .0 | .0 | .0 | .0 | .0 | .0 | .0 | .0 |
| Account Receivables | 20,440.0 | 26,440.0 | 35,550.0 | 32,460.0 | 42,980.0 | 37,118.7 | 39,997.2 | 43,099.0 | 46,441.4 | 50,042.9 |
| Account Receivables, % | 4.36 | 5.05 | 5.89 | 5.26 | 6.84 | 5.48 | 5.48 | 5.48 | 5.48 | 5.48 |
| Inventories | 35,790.0 | 40,960.0 | 42,510.0 | 40,220.0 | 44,150.0 | 48,831.3 | 52,618.2 | 56,698.7 | 61,095.7 | 65,833.7 |
| Inventories, % | 7.63 | 7.83 | 7.04 | 6.52 | 7.02 | 7.21 | 7.21 | 7.21 | 7.21 | 7.21 |
| Accounts Payable | 88,020.0 | 90,680.0 | 95,740.0 | 104,860.0 | 113,150.0 | 117,802.2 | 126,937.8 | 136,781.9 | 147,389.4 | 158,819.5 |
| Accounts Payable, % | 18.76 | 17.34 | 15.85 | 16.99 | 17.99 | 17.39 | 17.39 | 17.39 | 17.39 | 17.39 |
| Capital Expenditure | -41,630.0 | -12,280.0 | -11,920.0 | -14,770.0 | -12,750.0 | -23,869.9 | -25,721.1 | -27,715.8 | -29,865.1 | -32,181.2 |
| Capital Expenditure, % | -8.87 | -2.35 | -1.97 | -2.39 | -2.03 | -3.52 | -3.52 | -3.52 | -3.52 | -3.52 |
| Tax Rate, % | 26.13 | 26.13 | 26.13 | 26.13 | 26.13 | 26.13 | 26.13 | 26.13 | 26.13 | 26.13 |
| EBITAT | 80,613.4 | 89,403.2 | 101,874.9 | 103,611.3 | 107,509.5 | 115,230.6 | 124,166.7 | 133,795.9 | 144,171.9 | 155,352.5 |
| Depreciation | ||||||||||
| Changes in Account Receivables | ||||||||||
| Changes in Inventories | ||||||||||
| Changes in Accounts Payable | ||||||||||
| Capital Expenditure | ||||||||||
| UFCF | 81,513.4 | 79,523.2 | 95,724.9 | 115,501.3 | 102,149.5 | 111,262.2 | 116,076.2 | 125,078.0 | 134,777.8 | 145,229.9 |
| WACC, % | 5.27 | 5.27 | 5.27 | 5.27 | 5.27 | 5.27 | 5.27 | 5.27 | 5.27 | 5.27 |
| PV UFCF | ||||||||||
| SUM PV UFCF | 539,726.8 | |||||||||
| Long Term Growth Rate, % | 4.00 | |||||||||
| Free cash flow (T + 1) | 151,039 | |||||||||
| Terminal Value | 11,882,693 | |||||||||
| Present Terminal Value | 9,191,140 | |||||||||
| Enterprise Value | 9,730,867 | |||||||||
| Net Debt | -44,230 | |||||||||
| Equity Value | 9,775,097 | |||||||||
| Diluted Shares Outstanding, MM | 2,350 | |||||||||
| Equity Value Per Share | 4,160.08 |
What You Will Receive
- Authentic HINDUNILVRNS Financial Data: Pre-loaded with Hindustan Unilever's historical and forecasted data for accurate analysis.
- Customizable Template: Easily adjust key metrics such as revenue growth, WACC, and EBITDA percentage.
- Instant Calculations: Observe real-time updates of Hindustan Unilever's intrinsic value as you modify inputs.
- Professional Valuation Tool: Tailored for investors, analysts, and consultants in search of precise DCF results.
- User-Friendly Layout: Intuitive design and straightforward instructions suitable for all skill levels.
Key Features
- Customizable Financial Inputs: Adjust essential variables such as revenue growth, EBITDA margin, and capital investments.
- Instant DCF Valuation: Quickly computes intrinsic value, NPV, and other financial metrics.
- High Precision Accuracy: Leverages Hindustan Unilever's actual financial data for credible valuation results.
- Simplified Scenario Testing: Effortlessly explore various assumptions and analyze differing outcomes.
- Efficiency Booster: Remove the hassle of creating intricate valuation models from the ground up.
How It Operates
- Download the Template: Gain immediate access to the Excel-based HINDUNILVRNS DCF Calculator.
- Input Your Assumptions: Modify the yellow-highlighted cells for growth rates, WACC, margins, and other variables.
- Instant Calculations: The model automatically recalculates Hindustan Unilever’s intrinsic value.
- Test Scenarios: Explore various assumptions to assess potential changes in valuation.
- Analyze and Decide: Leverage the results to inform your investment or financial analysis.
Reasons to Choose Our Calculator
- Save Time: Get started instantly with a pre-built DCF model – no setup required.
- Enhance Accuracy: Utilize trusted financial data and formulas to minimize valuation errors.
- Completely Customizable: Adjust the model to align with your specific assumptions and forecasts.
- User-Friendly Design: Intuitive charts and outputs simplify result analysis.
- Endorsed by Professionals: Crafted for experts who prioritize both precision and ease of use.
Who Should Consider This Product?
- Individual Investors: Make informed choices regarding the purchase or sale of Hindustan Unilever Limited (HINDUNILVRNS) stocks.
- Financial Analysts: Enhance valuation processes with comprehensive financial models at your fingertips.
- Consultants: Provide clients with precise valuation insights related to Hindustan Unilever Limited (HINDUNILVRNS) efficiently.
- Business Owners: Gain an understanding of how major corporations like Hindustan Unilever Limited (HINDUNILVRNS) are valued to inform your own business strategies.
- Finance Students: Master valuation techniques using real-world data and practical examples pertaining to Hindustan Unilever Limited (HINDUNILVRNS).
Contents of the Template
- Pre-Filled Data: Contains Hindustan Unilever's historical financial performance and future projections.
- Discounted Cash Flow Model: An editable DCF valuation model that features automatic calculations.
- Weighted Average Cost of Capital (WACC): A specific sheet designed to calculate WACC using customizable inputs.
- Key Financial Ratios: Evaluate Hindustan Unilever's profitability, operational efficiency, and financial leverage.
- Customizable Inputs: Easily modify revenue growth, profit margins, and tax rates.
- Clear Dashboard: Visuals and tables that present the main valuation outcomes succinctly.
Disclaimer
All information, articles, and product details provided on this website are for general informational and educational purposes only. We do not claim any ownership over, nor do we intend to infringe upon, any trademarks, copyrights, logos, brand names, or other intellectual property mentioned or depicted on this site. Such intellectual property remains the property of its respective owners, and any references here are made solely for identification or informational purposes, without implying any affiliation, endorsement, or partnership.
We make no representations or warranties, express or implied, regarding the accuracy, completeness, or suitability of any content or products presented. Nothing on this website should be construed as legal, tax, investment, financial, medical, or other professional advice. In addition, no part of this site—including articles or product references—constitutes a solicitation, recommendation, endorsement, advertisement, or offer to buy or sell any securities, franchises, or other financial instruments, particularly in jurisdictions where such activity would be unlawful.
All content is of a general nature and may not address the specific circumstances of any individual or entity. It is not a substitute for professional advice or services. Any actions you take based on the information provided here are strictly at your own risk. You accept full responsibility for any decisions or outcomes arising from your use of this website and agree to release us from any liability in connection with your use of, or reliance upon, the content or products found herein.