
|
Avaliação Halma Plc (HLMA.L) DCF |
Totalmente Editável: Adapte-Se Às Suas Necessidades No Excel Ou Planilhas
Design Profissional: Modelos Confiáveis E Padrão Da Indústria
Pré-Construídos Para Uso Rápido E Eficiente
Compatível com MAC/PC, totalmente desbloqueado
Não É Necessária Experiência; Fácil De Seguir
Halma plc (HLMA.L) Bundle
Avalie as perspectivas financeiras da Halma Plc com experiência! Essa calculadora DCF (HLMAL) fornece dados financeiros pré-preenchidos e permite a liberdade de modificar o crescimento da receita, WACC, margens e várias suposições importantes para se alinhar com suas projeções.
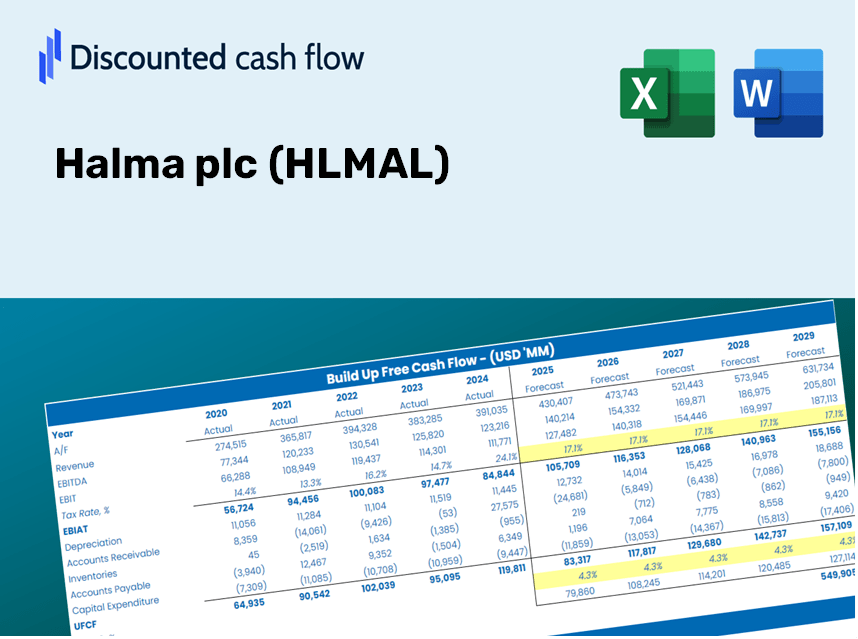
Discounted Cash Flow (DCF) - (USD MM)
| Year | AY1 2021 |
AY2 2022 |
AY3 2023 |
AY4 2024 |
AY5 2025 |
FY1 2026 |
FY2 2027 |
FY3 2028 |
FY4 2029 |
FY5 2030 |
|---|---|---|---|---|---|---|---|---|---|---|
| Revenue | 1,318.2 | 1,525.3 | 1,852.8 | 2,034.1 | 2,248.1 | 2,571.2 | 2,940.7 | 3,363.4 | 3,846.7 | 4,399.6 |
| Revenue Growth, % | 0 | 15.71 | 21.47 | 9.79 | 10.52 | 14.37 | 14.37 | 14.37 | 14.37 | 14.37 |
| EBITDA | 353.3 | 373.4 | 410.6 | 475.5 | 537.3 | 620.8 | 710.0 | 812.0 | 928.8 | 1,062.2 |
| EBITDA, % | 26.8 | 24.48 | 22.16 | 23.38 | 23.9 | 24.14 | 24.14 | 24.14 | 24.14 | 24.14 |
| Depreciation | 90.3 | 88.6 | 101.5 | 105.6 | 120.3 | 147.5 | 168.7 | 192.9 | 220.6 | 252.4 |
| Depreciation, % | 6.85 | 5.81 | 5.48 | 5.19 | 5.35 | 5.74 | 5.74 | 5.74 | 5.74 | 5.74 |
| EBIT | 263.0 | 284.8 | 309.1 | 369.9 | 417.0 | 473.3 | 541.3 | 619.1 | 708.1 | 809.9 |
| EBIT, % | 19.95 | 18.67 | 16.68 | 18.18 | 18.55 | 18.41 | 18.41 | 18.41 | 18.41 | 18.41 |
| Total Cash | 134.1 | 157.4 | 169.5 | 142.7 | 313.2 | 260.1 | 297.5 | 340.3 | 389.2 | 445.1 |
| Total Cash, percent | .0 | .0 | .0 | .0 | .0 | .0 | .0 | .0 | .0 | .0 |
| Account Receivables | 241.9 | 284.6 | 362.0 | 429.6 | 453.2 | 503.1 | 575.4 | 658.1 | 752.6 | 860.8 |
| Account Receivables, % | 18.35 | 18.66 | 19.54 | 21.12 | 20.16 | 19.57 | 19.57 | 19.57 | 19.57 | 19.57 |
| Inventories | 167.8 | 228.8 | 312.4 | 304.8 | 300.3 | 375.1 | 429.0 | 490.6 | 561.1 | 641.8 |
| Inventories, % | 12.73 | 15 | 16.86 | 14.98 | 13.36 | 14.59 | 14.59 | 14.59 | 14.59 | 14.59 |
| Accounts Payable | 84.8 | 102.5 | 116.9 | 117.5 | 131.5 | 159.9 | 182.8 | 209.1 | 239.2 | 273.6 |
| Accounts Payable, % | 6.43 | 6.72 | 6.31 | 5.78 | 5.85 | 6.22 | 6.22 | 6.22 | 6.22 | 6.22 |
| Capital Expenditure | -42.2 | -40.0 | -45.9 | -51.6 | -59.4 | -69.3 | -79.3 | -90.7 | -103.7 | -118.6 |
| Capital Expenditure, % | -3.2 | -2.62 | -2.48 | -2.54 | -2.64 | -2.7 | -2.7 | -2.7 | -2.7 | -2.7 |
| Tax Rate, % | 22.87 | 22.87 | 22.87 | 22.87 | 22.87 | 22.87 | 22.87 | 22.87 | 22.87 | 22.87 |
| EBITAT | 211.5 | 228.6 | 248.7 | 292.2 | 321.6 | 376.0 | 430.1 | 491.9 | 562.6 | 643.5 |
| Depreciation | ||||||||||
| Changes in Account Receivables | ||||||||||
| Changes in Inventories | ||||||||||
| Changes in Accounts Payable | ||||||||||
| Capital Expenditure | ||||||||||
| UFCF | -65.3 | 191.2 | 157.7 | 286.8 | 377.4 | 358.0 | 416.3 | 476.1 | 544.5 | 622.8 |
| WACC, % | 7.72 | 7.72 | 7.72 | 7.72 | 7.71 | 7.72 | 7.72 | 7.72 | 7.72 | 7.72 |
| PV UFCF | ||||||||||
| SUM PV UFCF | 1,905.8 | |||||||||
| Long Term Growth Rate, % | 3.00 | |||||||||
| Free cash flow (T + 1) | 641 | |||||||||
| Terminal Value | 13,592 | |||||||||
| Present Terminal Value | 9,372 | |||||||||
| Enterprise Value | 11,278 | |||||||||
| Net Debt | 536 | |||||||||
| Equity Value | 10,742 | |||||||||
| Diluted Shares Outstanding, MM | 379 | |||||||||
| Equity Value Per Share | 2,832.75 |
What You Will Receive
- Authentic Halma Data: Comprehensive financials – including revenue and EBIT – derived from actual and forecasted figures.
- Complete Customization: Modify all essential parameters (yellow cells) such as WACC, growth %, and tax rates.
- Immediate Valuation Refresh: Automatic recalculations to assess how changes affect Halma plc’s fair value.
- Flexible Excel Template: Designed for quick modifications, scenario analysis, and in-depth projections.
- Efficient and Precise: Eliminate the need to build models from the ground up while ensuring accuracy and adaptability.
Key Features
- Comprehensive Historical Data: Halma plc’s financial statements and pre-filled projections.
- Customizable Inputs: Modify WACC, tax rates, revenue growth, and EBITDA margins as needed.
- Real-Time Calculations: Observe the recalibration of Halma plc’s intrinsic value instantly.
- Visualized Outputs: Dashboard graphs present valuation results and essential metrics clearly.
- Precision-Focused Design: A reliable tool tailored for analysts, investors, and finance professionals.
How It Works
- Step 1: Download the prebuilt Excel template featuring Halma plc (HLMAL) data.
- Step 2: Review the pre-filled sheets to familiarize yourself with the key metrics.
- Step 3: Modify forecasts and assumptions in the editable yellow cells (WACC, growth, margins).
- Step 4: Instantly view the recalculated results, including Halma plc's (HLMAL) intrinsic value.
- Step 5: Utilize the outputs to make informed investment decisions or create detailed reports.
Why Choose This Calculator for Halma plc (HLMAL)?
- User-Friendly Interface: Perfect for both novices and seasoned professionals.
- Customizable Inputs: Effortlessly adjust variables to suit your analysis needs.
- Real-Time Updates: Observe immediate changes in Halma's valuation as you modify inputs.
- Preloaded Data: Comes with Halma's latest financial information for swift evaluations.
- Relied Upon by Experts: A preferred tool among investors and analysts for making educated choices.
Who Can Benefit from Halma plc (HLMAL)?
- Investors: Gain the confidence to make informed decisions with our advanced analysis tools.
- Financial Analysts: Streamline your workflow with our customizable financial models designed for efficiency.
- Consultants: Easily modify resources for impactful client presentations and insightful reports.
- Finance Enthusiasts: Enrich your knowledge of valuation methods through practical, real-life applications.
- Educators and Students: Utilize our resources as a hands-on learning aid in finance-related studies.
Contents of the Template
- Pre-Filled Data: Contains Halma plc's historical financial performance and projections.
- Discounted Cash Flow Model: An editable DCF valuation model featuring automatic calculations.
- Weighted Average Cost of Capital (WACC): A dedicated sheet for WACC calculations based on your inputs.
- Key Financial Ratios: Assess Halma plc's profitability, efficiency, and financial leverage.
- Customizable Inputs: Easily modify revenue growth rates, margins, and tax rates.
- User-Friendly Dashboard: Visuals and tables that summarize critical valuation outcomes.
Disclaimer
All information, articles, and product details provided on this website are for general informational and educational purposes only. We do not claim any ownership over, nor do we intend to infringe upon, any trademarks, copyrights, logos, brand names, or other intellectual property mentioned or depicted on this site. Such intellectual property remains the property of its respective owners, and any references here are made solely for identification or informational purposes, without implying any affiliation, endorsement, or partnership.
We make no representations or warranties, express or implied, regarding the accuracy, completeness, or suitability of any content or products presented. Nothing on this website should be construed as legal, tax, investment, financial, medical, or other professional advice. In addition, no part of this site—including articles or product references—constitutes a solicitation, recommendation, endorsement, advertisement, or offer to buy or sell any securities, franchises, or other financial instruments, particularly in jurisdictions where such activity would be unlawful.
All content is of a general nature and may not address the specific circumstances of any individual or entity. It is not a substitute for professional advice or services. Any actions you take based on the information provided here are strictly at your own risk. You accept full responsibility for any decisions or outcomes arising from your use of this website and agree to release us from any liability in connection with your use of, or reliance upon, the content or products found herein.