
|
Avaliação DCF HubSpot, Inc. (Hubs) |
Totalmente Editável: Adapte-Se Às Suas Necessidades No Excel Ou Planilhas
Design Profissional: Modelos Confiáveis E Padrão Da Indústria
Pré-Construídos Para Uso Rápido E Eficiente
Compatível com MAC/PC, totalmente desbloqueado
Não É Necessária Experiência; Fácil De Seguir
HubSpot, Inc. (HUBS) Bundle
Simplificar a avaliação HubSpot, Inc. (Hubs) com esta calculadora DCF personalizável! Com o Real HubSpot, Inc. (hubs) financeiros e insumos de previsão ajustáveis, você pode testar cenários e descobrir o valor justo da HubSpot, Inc. (Hubs) em minutos.
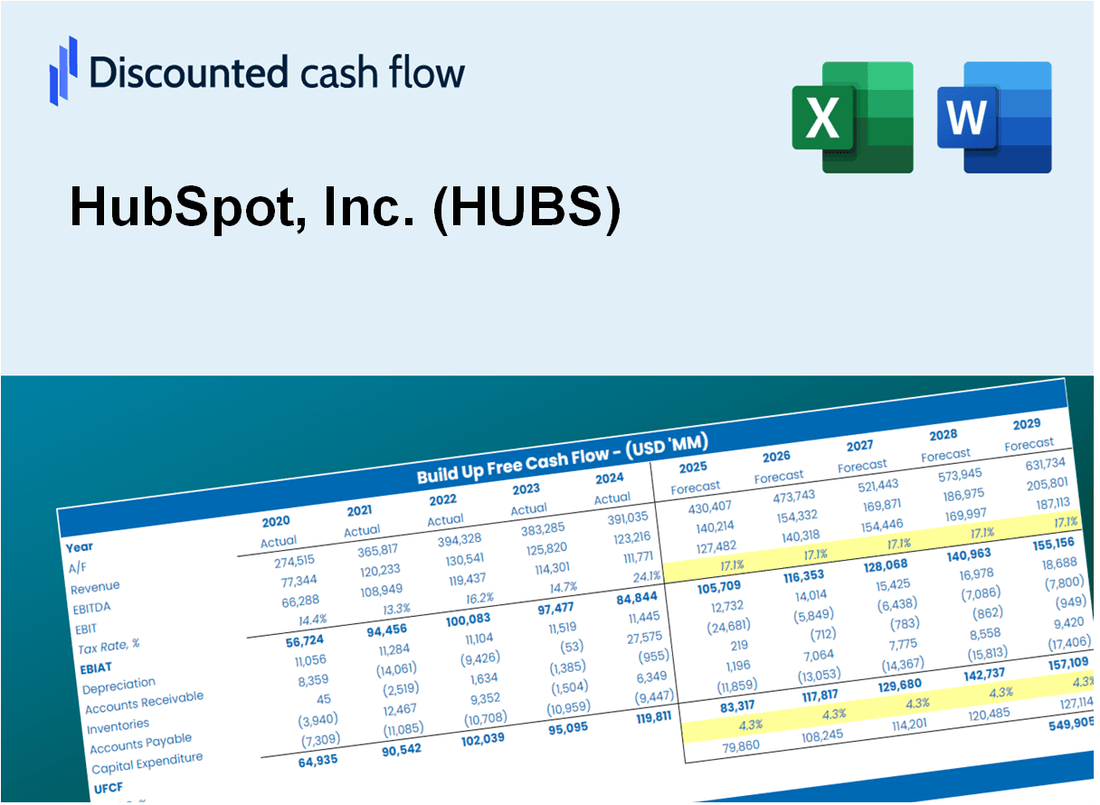
Discounted Cash Flow (DCF) - (USD MM)
| Year | AY1 2020 |
AY2 2021 |
AY3 2022 |
AY4 2023 |
AY5 2024 |
FY1 2025 |
FY2 2026 |
FY3 2027 |
FY4 2028 |
FY5 2029 |
|---|---|---|---|---|---|---|---|---|---|---|
| Revenue | 883.0 | 1,300.7 | 1,731.0 | 2,170.2 | 2,627.5 | 3,460.7 | 4,557.9 | 6,003.1 | 7,906.5 | 10,413.5 |
| Revenue Growth, % | 0 | 47.3 | 33.08 | 25.38 | 21.07 | 31.71 | 31.71 | 31.71 | 31.71 | 31.71 |
| EBITDA | -6.7 | 1.6 | -36.5 | -74.1 | 129.2 | -8.6 | -11.3 | -14.9 | -19.6 | -25.9 |
| EBITDA, % | -0.75943 | 0.12478 | -2.11 | -3.41 | 4.92 | -0.24839 | -0.24839 | -0.24839 | -0.24839 | -0.24839 |
| Depreciation | 37.1 | 45.2 | 58.2 | 72.7 | 96.8 | 125.0 | 164.7 | 216.9 | 285.6 | 376.2 |
| Depreciation, % | 4.2 | 3.47 | 3.36 | 3.35 | 3.69 | 3.61 | 3.61 | 3.61 | 3.61 | 3.61 |
| EBIT | -43.8 | -43.5 | -94.7 | -146.8 | 32.4 | -133.6 | -176.0 | -231.8 | -305.3 | -402.0 |
| EBIT, % | -4.96 | -3.35 | -5.47 | -6.76 | 1.23 | -3.86 | -3.86 | -3.86 | -3.86 | -3.86 |
| Total Cash | 1,251.2 | 1,198.0 | 1,412.7 | 1,388.2 | 2,069.5 | 2,882.4 | 3,796.3 | 5,000.0 | 6,585.3 | 8,673.3 |
| Total Cash, percent | .0 | .0 | .0 | .0 | .0 | .0 | .0 | .0 | .0 | .0 |
| Account Receivables | 126.4 | 157.4 | 226.8 | 295.3 | 334.8 | 455.9 | 600.5 | 790.9 | 1,041.6 | 1,371.9 |
| Account Receivables, % | 14.32 | 12.1 | 13.11 | 13.61 | 12.74 | 13.17 | 13.17 | 13.17 | 13.17 | 13.17 |
| Inventories | .0 | .0 | .0 | .0 | .0 | .0 | .0 | .0 | .0 | .0 |
| Inventories, % | 0 | 0 | 0 | 0 | 0 | 0 | 0 | 0 | 0 | 0 |
| Accounts Payable | 13.5 | 2.8 | 20.9 | 9.1 | 3.6 | 24.3 | 32.0 | 42.2 | 55.5 | 73.1 |
| Accounts Payable, % | 1.53 | 0.2132 | 1.21 | 0.41959 | 0.13887 | 0.70229 | 0.70229 | 0.70229 | 0.70229 | 0.70229 |
| Capital Expenditure | -58.9 | -61.9 | -91.8 | -100.3 | -37.9 | -157.7 | -207.7 | -273.6 | -360.4 | -474.6 |
| Capital Expenditure, % | -6.67 | -4.76 | -5.3 | -4.62 | -1.44 | -4.56 | -4.56 | -4.56 | -4.56 | -4.56 |
| Tax Rate, % | 83.86 | 83.86 | 83.86 | 83.86 | 83.86 | 83.86 | 83.86 | 83.86 | 83.86 | 83.86 |
| EBITAT | -46.0 | -45.9 | -103.2 | -160.4 | 5.2 | -111.2 | -146.5 | -192.9 | -254.1 | -334.6 |
| Depreciation | ||||||||||
| Changes in Account Receivables | ||||||||||
| Changes in Inventories | ||||||||||
| Changes in Accounts Payable | ||||||||||
| Capital Expenditure | ||||||||||
| UFCF | -180.8 | -104.3 | -188.2 | -268.2 | 19.1 | -244.4 | -326.4 | -429.9 | -566.2 | -745.7 |
| WACC, % | 10.97 | 10.97 | 10.97 | 10.97 | 10.88 | 10.95 | 10.95 | 10.95 | 10.95 | 10.95 |
| PV UFCF | ||||||||||
| SUM PV UFCF | -1,617.3 | |||||||||
| Long Term Growth Rate, % | 2.00 | |||||||||
| Free cash flow (T + 1) | -761 | |||||||||
| Terminal Value | -8,497 | |||||||||
| Present Terminal Value | -5,054 | |||||||||
| Enterprise Value | -6,671 | |||||||||
| Net Debt | 233 | |||||||||
| Equity Value | -6,904 | |||||||||
| Diluted Shares Outstanding, MM | 52 | |||||||||
| Equity Value Per Share | -133.22 |
What You Will Get
- Real HubSpot Data: Preloaded financials – from revenue to EBIT – based on actual and projected figures.
- Full Customization: Adjust all critical parameters (yellow cells) like WACC, growth %, and tax rates.
- Instant Valuation Updates: Automatic recalculations to analyze the impact of changes on HubSpot’s fair value.
- Versatile Excel Template: Tailored for quick edits, scenario testing, and detailed projections.
- Time-Saving and Accurate: Skip building models from scratch while maintaining precision and flexibility.
Key Features
- Comprehensive Marketing Automation: Streamline your marketing efforts with advanced tools for email campaigns and lead nurturing.
- CRM Integration: Seamlessly connect your customer relationship management system for enhanced tracking and engagement.
- Customizable Reporting: Tailor reports to analyze key performance indicators and gain insights into your marketing strategies.
- Analytics Dashboard: Visualize data and metrics in real-time to monitor the effectiveness of campaigns.
- Customer Support Tools: Access a suite of resources to enhance customer interactions and support efficiency.
How It Works
- Step 1: Download the prebuilt Excel template featuring HubSpot’s data included.
- Step 2: Navigate through the pre-filled sheets to familiarize yourself with the key metrics.
- Step 3: Modify forecasts and assumptions in the editable yellow cells (WACC, growth, margins).
- Step 4: Instantly see recalculated results, including HubSpot’s intrinsic value.
- Step 5: Make informed investment decisions or create reports based on the outputs.
Why Choose HubSpot's Tools?
- All-in-One Solution: Combines CRM, marketing, and sales analytics for a comprehensive approach.
- Flexible Customization: Modify highlighted fields to explore different marketing strategies.
- In-Depth Analytics: Automatically generates insights on customer engagement and conversion rates.
- Up-to-Date Information: Access to real-time data ensures informed decision-making.
- Enterprise-Level Quality: Perfect for marketers, sales teams, and business strategists.
Who Should Use This Product?
- Marketers: Optimize HubSpot’s tools to enhance their digital marketing strategies.
- Sales Teams: Utilize the CRM features to streamline sales processes and improve customer relationships.
- Business Owners: Gain valuable insights into customer engagement and retention metrics.
- Consultants: Tailor HubSpot’s functionalities to provide customized solutions for clients.
- Educators: Incorporate it into curricula to teach marketing automation and inbound marketing principles.
What the Template Contains
- Historical Data: Includes HubSpot’s past financials and baseline forecasts.
- DCF and Levered DCF Models: Detailed templates to calculate HubSpot’s intrinsic value.
- WACC Sheet: Pre-built calculations for Weighted Average Cost of Capital.
- Editable Inputs: Modify key drivers like growth rates, EBITDA %, and CAPEX assumptions.
- Quarterly and Annual Statements: A complete breakdown of HubSpot’s financials.
- Interactive Dashboard: Visualize valuation results and projections dynamically.
Disclaimer
All information, articles, and product details provided on this website are for general informational and educational purposes only. We do not claim any ownership over, nor do we intend to infringe upon, any trademarks, copyrights, logos, brand names, or other intellectual property mentioned or depicted on this site. Such intellectual property remains the property of its respective owners, and any references here are made solely for identification or informational purposes, without implying any affiliation, endorsement, or partnership.
We make no representations or warranties, express or implied, regarding the accuracy, completeness, or suitability of any content or products presented. Nothing on this website should be construed as legal, tax, investment, financial, medical, or other professional advice. In addition, no part of this site—including articles or product references—constitutes a solicitation, recommendation, endorsement, advertisement, or offer to buy or sell any securities, franchises, or other financial instruments, particularly in jurisdictions where such activity would be unlawful.
All content is of a general nature and may not address the specific circumstances of any individual or entity. It is not a substitute for professional advice or services. Any actions you take based on the information provided here are strictly at your own risk. You accept full responsibility for any decisions or outcomes arising from your use of this website and agree to release us from any liability in connection with your use of, or reliance upon, the content or products found herein.