
|
HARWORTH GROUP PLC (HWG.L) Avaliação DCF |
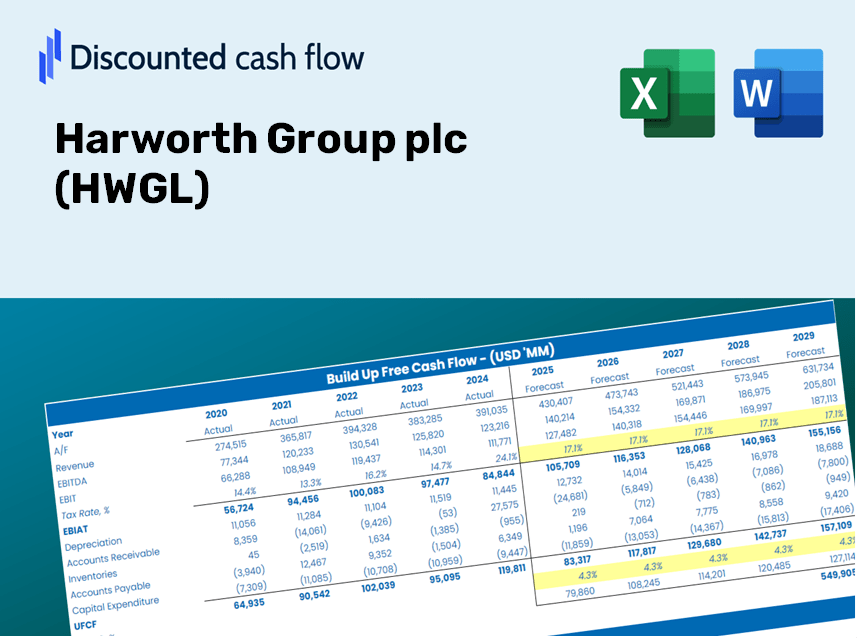
Totalmente Editável: Adapte-Se Às Suas Necessidades No Excel Ou Planilhas
Design Profissional: Modelos Confiáveis E Padrão Da Indústria
Pré-Construídos Para Uso Rápido E Eficiente
Compatível com MAC/PC, totalmente desbloqueado
Não É Necessária Experiência; Fácil De Seguir
Harworth Group plc (HWG.L) Bundle
Projetado para precisão, a calculadora DCF do Harworth Group PLC (HWGL) permite avaliar a avaliação do Harworth Group PLC usando dados financeiros atualizados, fornecendo flexibilidade completa para modificar todos os parâmetros essenciais para projeções aprimoradas.
Discounted Cash Flow (DCF) - (USD MM)
| Year | AY1 2020 |
AY2 2021 |
AY3 2022 |
AY4 2023 |
AY5 2024 |
FY1 2025 |
FY2 2026 |
FY3 2027 |
FY4 2028 |
FY5 2029 |
|---|---|---|---|---|---|---|---|---|---|---|
| Revenue | 70.0 | 109.9 | 166.7 | 72.4 | 181.6 | 190.0 | 198.9 | 208.2 | 217.9 | 228.0 |
| Revenue Growth, % | 0 | 56.97 | 51.69 | -56.55 | 150.71 | 4.66 | 4.66 | 4.66 | 4.66 | 4.66 |
| EBITDA | -2.9 | 30.8 | 61.3 | 54.3 | 77.7 | 67.8 | 71.0 | 74.3 | 77.7 | 81.3 |
| EBITDA, % | -4.2 | 27.98 | 36.78 | 74.99 | 42.81 | 35.67 | 35.67 | 35.67 | 35.67 | 35.67 |
| Depreciation | .3 | .2 | .2 | .3 | .4 | .5 | .5 | .6 | .6 | .6 |
| Depreciation, % | 0.40714 | 0.21295 | 0.09118997 | 0.38936 | 0.22359 | 0.26484 | 0.26484 | 0.26484 | 0.26484 | 0.26484 |
| EBIT | -3.2 | 30.5 | 61.2 | 54.0 | 77.3 | 67.3 | 70.4 | 73.7 | 77.1 | 80.7 |
| EBIT, % | -4.61 | 27.77 | 36.69 | 74.6 | 42.58 | 35.41 | 35.41 | 35.41 | 35.41 | 35.41 |
| Total Cash | 12.7 | 12.0 | 11.6 | 27.2 | 117.4 | 52.5 | 55.0 | 57.5 | 60.2 | 63.0 |
| Total Cash, percent | .0 | .0 | .0 | .0 | .0 | .0 | .0 | .0 | .0 | .0 |
| Account Receivables | 35.4 | 24.1 | 31.5 | 16.9 | 72.6 | 58.8 | 61.6 | 64.4 | 67.4 | 70.6 |
| Account Receivables, % | 50.62 | 21.89 | 18.92 | 23.37 | 39.97 | 30.95 | 30.95 | 30.95 | 30.95 | 30.95 |
| Inventories | 182.7 | 177.8 | 216.4 | 263.1 | 195.5 | 190.0 | 198.9 | 208.2 | 217.9 | 228.0 |
| Inventories, % | 260.95 | 161.83 | 129.82 | 363.23 | 107.69 | 100 | 100 | 100 | 100 | 100 |
| Accounts Payable | 1.7 | 2.1 | 2.4 | .8 | 136.0 | 31.0 | 32.5 | 34.0 | 35.6 | 37.2 |
| Accounts Payable, % | 2.37 | 1.91 | 1.42 | 1.05 | 74.89 | 16.33 | 16.33 | 16.33 | 16.33 | 16.33 |
| Capital Expenditure | -.1 | .0 | -.1 | -.4 | -47.6 | -10.3 | -10.8 | -11.3 | -11.8 | -12.3 |
| Capital Expenditure, % | -0.16428 | -0.02912162 | -0.06599274 | -0.54676 | -26.22 | -5.4 | -5.4 | -5.4 | -5.4 | -5.4 |
| Tax Rate, % | 17.51 | 17.51 | 17.51 | 17.51 | 17.51 | 17.51 | 17.51 | 17.51 | 17.51 | 17.51 |
| EBITAT | -2.5 | 22.5 | 55.2 | 41.2 | 63.8 | 53.9 | 56.4 | 59.0 | 61.7 | 64.6 |
| Depreciation | ||||||||||
| Changes in Account Receivables | ||||||||||
| Changes in Inventories | ||||||||||
| Changes in Accounts Payable | ||||||||||
| Capital Expenditure | ||||||||||
| UFCF | -218.8 | 39.4 | 9.4 | 7.4 | 163.7 | -41.6 | 36.0 | 37.7 | 39.4 | 41.3 |
| WACC, % | 5.52 | 5.48 | 5.66 | 5.5 | 5.57 | 5.55 | 5.55 | 5.55 | 5.55 | 5.55 |
| PV UFCF | ||||||||||
| SUM PV UFCF | 88.2 | |||||||||
| Long Term Growth Rate, % | 3.50 | |||||||||
| Free cash flow (T + 1) | 43 | |||||||||
| Terminal Value | 2,088 | |||||||||
| Present Terminal Value | 1,594 | |||||||||
| Enterprise Value | 1,682 | |||||||||
| Net Debt | 48 | |||||||||
| Equity Value | 1,634 | |||||||||
| Diluted Shares Outstanding, MM | 331 | |||||||||
| Equity Value Per Share | 493.20 |
What You Will Receive
- Authentic Harworth Data: Preloaded financials – encompassing revenue, EBIT, and more – grounded in actual and projected metrics.
- Complete Customization: Modify all essential parameters (yellow cells) such as WACC, growth percentages, and tax rates.
- Instant Valuation Adjustments: Automatic recalculations to assess the effects of changes on Harworth's fair value.
- Flexible Excel Template: Designed for easy edits, scenario analysis, and comprehensive forecasting.
- Efficient and Precise: Eliminate the need to build models from scratch while ensuring accuracy and adaptability.
Key Features
- Comprehensive DCF Calculator: Features extensive unlevered and levered DCF valuation frameworks.
- WACC Calculator: Ready-made Weighted Average Cost of Capital template with adjustable parameters.
- Customizable Forecast Assumptions: Alter growth rates, capital expenditures, and discount rates as needed.
- Integrated Financial Ratios: Evaluate profitability, leverage, and efficiency ratios for Harworth Group plc (HWGL).
- Interactive Dashboard and Charts: Visual representations that highlight essential valuation metrics for straightforward analysis.
How It Operates
- 1. Access the Template: Download and open the Excel file containing Harworth Group plc’s (HWGL) preloaded data.
- 2. Adjust Key Assumptions: Modify essential inputs such as growth rates, WACC, and capital expenditures.
- 3. Instant Results: The DCF model automatically computes intrinsic value and NPV in real-time.
- 4. Explore Different Scenarios: Analyze various forecasts to evaluate distinct valuation results.
- 5. Present with Confidence: Deliver professional valuation insights to bolster your decision-making.
Why Opt for This Calculator?
- All-Inclusive Tool: Features DCF, WACC, and financial ratio analyses consolidated in one solution.
- Flexible Inputs: Modify the yellow-highlighted cells to explore different scenarios.
- In-Depth Analysis: Automatically computes Harworth Group plc’s intrinsic value and Net Present Value.
- Preloaded Information: Historical and projected data provide reliable starting points.
- High-Quality Standards: Perfect for financial analysts, investors, and business consultants.
Who Can Benefit from This Product?
- Finance Students: Master valuation methods and practice with actual data.
- Academics: Integrate industry-standard models into your teaching or research projects.
- Investors: Validate your hypotheses and evaluate valuation scenarios for Harworth Group plc (HWGL).
- Analysts: Enhance your productivity with a ready-to-use, customizable DCF model.
- Small Business Owners: Discover how major public companies like Harworth Group plc (HWGL) are assessed.
Contents of the Template
- Operating and Balance Sheet Data: Pre-populated historical data and forecasts for Harworth Group plc (HWGL), including revenue, EBITDA, EBIT, and capital expenditures.
- WACC Calculation: A dedicated sheet for calculating the Weighted Average Cost of Capital (WACC), featuring parameters such as Beta, risk-free rate, and share price.
- DCF Valuation (Unlevered and Levered): Editable Discounted Cash Flow models that provide intrinsic value with comprehensive calculations.
- Financial Statements: Pre-loaded annual and quarterly financial statements to facilitate in-depth analysis.
- Key Ratios: A collection of profitability, leverage, and efficiency ratios specifically for Harworth Group plc (HWGL).
- Dashboard and Charts: A visual summary of valuation outputs and assumptions for easy analysis of results.
Disclaimer
All information, articles, and product details provided on this website are for general informational and educational purposes only. We do not claim any ownership over, nor do we intend to infringe upon, any trademarks, copyrights, logos, brand names, or other intellectual property mentioned or depicted on this site. Such intellectual property remains the property of its respective owners, and any references here are made solely for identification or informational purposes, without implying any affiliation, endorsement, or partnership.
We make no representations or warranties, express or implied, regarding the accuracy, completeness, or suitability of any content or products presented. Nothing on this website should be construed as legal, tax, investment, financial, medical, or other professional advice. In addition, no part of this site—including articles or product references—constitutes a solicitation, recommendation, endorsement, advertisement, or offer to buy or sell any securities, franchises, or other financial instruments, particularly in jurisdictions where such activity would be unlawful.
All content is of a general nature and may not address the specific circumstances of any individual or entity. It is not a substitute for professional advice or services. Any actions you take based on the information provided here are strictly at your own risk. You accept full responsibility for any decisions or outcomes arising from your use of this website and agree to release us from any liability in connection with your use of, or reliance upon, the content or products found herein.