|
Avaliação DCF de HydroFarm Holdings Group, Inc. (HYFM) |
Totalmente Editável: Adapte-Se Às Suas Necessidades No Excel Ou Planilhas
Design Profissional: Modelos Confiáveis E Padrão Da Indústria
Pré-Construídos Para Uso Rápido E Eficiente
Compatível com MAC/PC, totalmente desbloqueado
Não É Necessária Experiência; Fácil De Seguir
Hydrofarm Holdings Group, Inc. (HYFM) Bundle
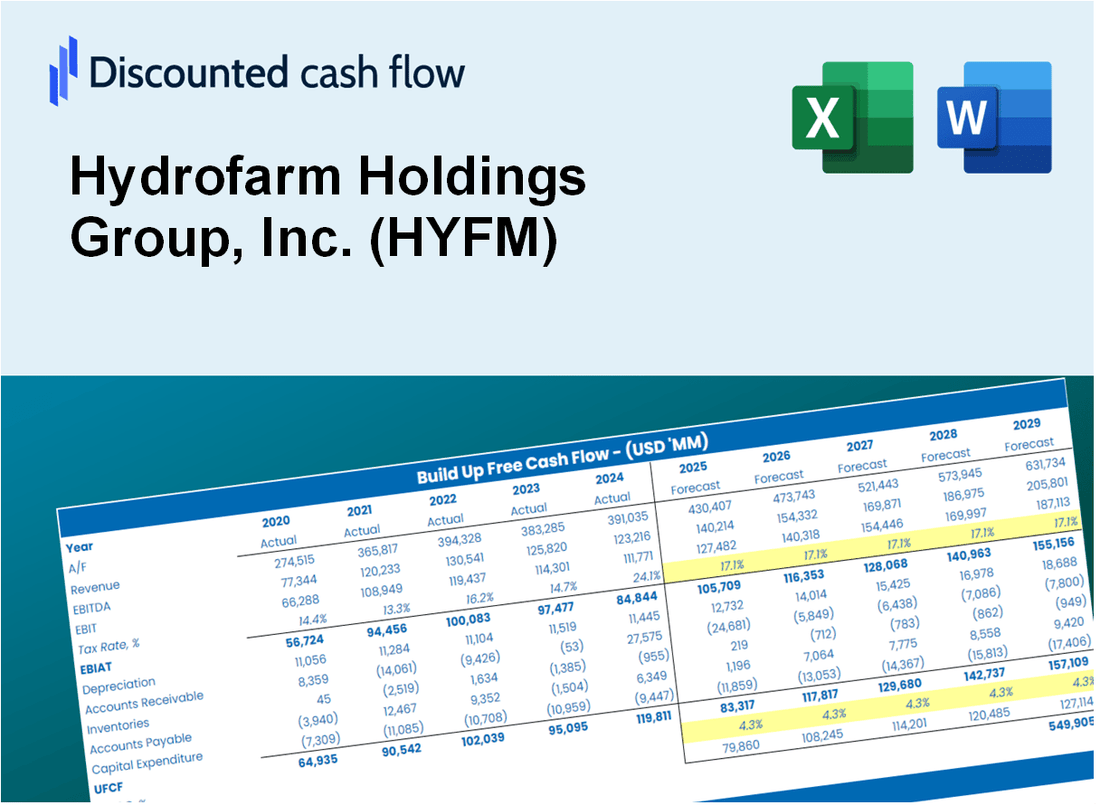
Projetado para precisão, nossa calculadora DCF (HYFM) capacita você a avaliar a avaliação do HydroFarm Holdings Group, Inc. usando dados financeiros reais, oferecendo flexibilidade completa para modificar todos os parâmetros essenciais para previsões aprimoradas.
Discounted Cash Flow (DCF) - (USD MM)
| Year | AY1 2020 |
AY2 2021 |
AY3 2022 |
AY4 2023 |
AY5 2024 |
FY1 2025 |
FY2 2026 |
FY3 2027 |
FY4 2028 |
FY5 2029 |
|---|---|---|---|---|---|---|---|---|---|---|
| Revenue | 342.2 | 479.4 | 344.5 | 226.6 | 190.3 | 172.1 | 155.6 | 140.7 | 127.2 | 115.1 |
| Revenue Growth, % | 0 | 40.1 | -28.14 | -34.23 | -16.02 | -9.57 | -9.57 | -9.57 | -9.57 | -9.57 |
| EBITDA | 13.7 | 17.0 | -229.6 | -17.5 | -19.9 | -26.6 | -24.1 | -21.8 | -19.7 | -17.8 |
| EBITDA, % | 4 | 3.55 | -66.65 | -7.73 | -10.47 | -15.46 | -15.46 | -15.46 | -15.46 | -15.46 |
| Depreciation | 10.2 | 20.6 | 51.3 | 32.1 | 30.7 | 18.1 | 16.3 | 14.8 | 13.3 | 12.1 |
| Depreciation, % | 2.99 | 4.3 | 14.88 | 14.16 | 16.13 | 10.49 | 10.49 | 10.49 | 10.49 | 10.49 |
| EBIT | 3.4 | -3.6 | -280.9 | -49.6 | -50.6 | -44.7 | -40.4 | -36.5 | -33.0 | -29.9 |
| EBIT, % | 1.01 | -0.74736 | -81.54 | -21.88 | -26.6 | -25.95 | -25.95 | -25.95 | -25.95 | -25.95 |
| Total Cash | 75.2 | 26.6 | 21.3 | 30.3 | 26.1 | 20.9 | 18.9 | 17.1 | 15.5 | 14.0 |
| Total Cash, percent | .0 | .0 | .0 | .0 | .0 | .0 | .0 | .0 | .0 | .0 |
| Account Receivables | 24.8 | 42.1 | 17.2 | 16.9 | 14.8 | 12.5 | 11.3 | 10.2 | 9.2 | 8.3 |
| Account Receivables, % | 7.24 | 8.78 | 5 | 7.45 | 7.75 | 7.25 | 7.25 | 7.25 | 7.25 | 7.25 |
| Inventories | 88.6 | 189.1 | 111.4 | 75.4 | 50.6 | 54.2 | 49.0 | 44.3 | 40.1 | 36.3 |
| Inventories, % | 25.9 | 39.45 | 32.34 | 33.26 | 26.61 | 31.51 | 31.51 | 31.51 | 31.51 | 31.51 |
| Accounts Payable | 22.6 | 26.7 | 13.6 | 12.6 | 12.3 | 9.7 | 8.8 | 7.9 | 7.2 | 6.5 |
| Accounts Payable, % | 6.62 | 5.57 | 3.96 | 5.57 | 6.45 | 5.63 | 5.63 | 5.63 | 5.63 | 5.63 |
| Capital Expenditure | -1.4 | -5.4 | -8.2 | -4.2 | -2.9 | -2.5 | -2.3 | -2.1 | -1.9 | -1.7 |
| Capital Expenditure, % | -0.42285 | -1.13 | -2.39 | -1.86 | -1.52 | -1.46 | -1.46 | -1.46 | -1.46 | -1.46 |
| Tax Rate, % | 1.29 | 1.29 | 1.29 | 1.29 | 1.29 | 1.29 | 1.29 | 1.29 | 1.29 | 1.29 |
| EBITAT | 3.7 | 8.4 | -274.7 | -49.4 | -50.0 | -35.4 | -32.0 | -28.9 | -26.2 | -23.7 |
| Depreciation | ||||||||||
| Changes in Account Receivables | ||||||||||
| Changes in Inventories | ||||||||||
| Changes in Accounts Payable | ||||||||||
| Capital Expenditure | ||||||||||
| UFCF | -78.2 | -90.2 | -142.1 | 13.8 | 4.4 | -23.7 | -12.5 | -11.3 | -10.2 | -9.2 |
| WACC, % | 9.25 | 0.67622 | 9.06 | 9.22 | 9.14 | 7.47 | 7.47 | 7.47 | 7.47 | 7.47 |
| PV UFCF | ||||||||||
| SUM PV UFCF | -56.1 | |||||||||
| Long Term Growth Rate, % | 2.00 | |||||||||
| Free cash flow (T + 1) | -9 | |||||||||
| Terminal Value | -172 | |||||||||
| Present Terminal Value | -120 | |||||||||
| Enterprise Value | -176 | |||||||||
| Net Debt | 143 | |||||||||
| Equity Value | -320 | |||||||||
| Diluted Shares Outstanding, MM | 5 | |||||||||
| Equity Value Per Share | -69.51 |
What You Will Get
- Real HYFM Financial Data: Pre-filled with Hydrofarm's historical and projected data for precise analysis.
- Fully Editable Template: Modify key inputs like revenue growth, WACC, and EBITDA % with ease.
- Automatic Calculations: See Hydrofarm's intrinsic value update instantly based on your changes.
- Professional Valuation Tool: Designed for investors, analysts, and consultants seeking accurate DCF results.
- User-Friendly Design: Simple structure and clear instructions for all experience levels.
Key Features
- Pre-Loaded Data: Hydrofarm's historical financial statements and pre-filled forecasts.
- Fully Adjustable Inputs: Modify WACC, tax rates, revenue growth, and EBITDA margins as needed.
- Instant Results: View Hydrofarm's intrinsic value recalculating in real time.
- Clear Visual Outputs: Dashboard charts illustrate valuation results and essential metrics.
- Built for Accuracy: A professional tool designed for analysts, investors, and finance professionals.
How It Works
- Step 1: Download the Excel file for Hydrofarm Holdings Group, Inc. (HYFM).
- Step 2: Review Hydrofarm’s pre-filled financial data and forecasts.
- Step 3: Adjust key inputs such as revenue growth, WACC, and tax rates (highlighted cells).
- Step 4: Observe the DCF model update in real-time as you modify your assumptions.
- Step 5: Evaluate the outputs and leverage the results for informed investment decisions.
Why Choose Hydrofarm's Calculator?
- Accuracy: Leverages real Hydrofarm financials for precise data.
- Flexibility: Tailored for users to easily test and adjust inputs.
- Time-Saving: Eliminate the need to create a DCF model from the ground up.
- Professional-Grade: Crafted with CFO-level accuracy and usability in focus.
- User-Friendly: Intuitive design, suitable for users without extensive financial modeling skills.
Who Should Use Hydrofarm Holdings Group, Inc. (HYFM)?
- Agriculture Students: Explore innovative growing techniques and apply them with real-world data.
- Researchers: Integrate advanced agricultural models into academic studies or projects.
- Investors: Evaluate your investment strategies and analyze market trends for Hydrofarm (HYFM).
- Industry Analysts: Enhance your analysis with a customizable financial model tailored for the agriculture sector.
- Entrepreneurs: Discover how established companies like Hydrofarm are navigating the agriculture market.
What the Template Contains
- Operating and Balance Sheet Data: Pre-filled Hydrofarm Holdings Group historical data and forecasts, including revenue, EBITDA, EBIT, and capital expenditures.
- WACC Calculation: A dedicated sheet for Weighted Average Cost of Capital (WACC), including parameters like Beta, risk-free rate, and share price.
- DCF Valuation (Unlevered and Levered): Editable Discounted Cash Flow models showing intrinsic value with detailed calculations.
- Financial Statements: Pre-loaded financial statements (annual and quarterly) to support analysis.
- Key Ratios: Includes profitability, leverage, and efficiency ratios for Hydrofarm Holdings Group, Inc. (HYFM).
- Dashboard and Charts: Visual summary of valuation outputs and assumptions to analyze results easily.
Disclaimer
All information, articles, and product details provided on this website are for general informational and educational purposes only. We do not claim any ownership over, nor do we intend to infringe upon, any trademarks, copyrights, logos, brand names, or other intellectual property mentioned or depicted on this site. Such intellectual property remains the property of its respective owners, and any references here are made solely for identification or informational purposes, without implying any affiliation, endorsement, or partnership.
We make no representations or warranties, express or implied, regarding the accuracy, completeness, or suitability of any content or products presented. Nothing on this website should be construed as legal, tax, investment, financial, medical, or other professional advice. In addition, no part of this site—including articles or product references—constitutes a solicitation, recommendation, endorsement, advertisement, or offer to buy or sell any securities, franchises, or other financial instruments, particularly in jurisdictions where such activity would be unlawful.
All content is of a general nature and may not address the specific circumstances of any individual or entity. It is not a substitute for professional advice or services. Any actions you take based on the information provided here are strictly at your own risk. You accept full responsibility for any decisions or outcomes arising from your use of this website and agree to release us from any liability in connection with your use of, or reliance upon, the content or products found herein.