
|
Vodafone Idea Limited (Idea.NS) Avaliação DCF |
Totalmente Editável: Adapte-Se Às Suas Necessidades No Excel Ou Planilhas
Design Profissional: Modelos Confiáveis E Padrão Da Indústria
Pré-Construídos Para Uso Rápido E Eficiente
Compatível com MAC/PC, totalmente desbloqueado
Não É Necessária Experiência; Fácil De Seguir
Vodafone Idea Limited (IDEA.NS) Bundle
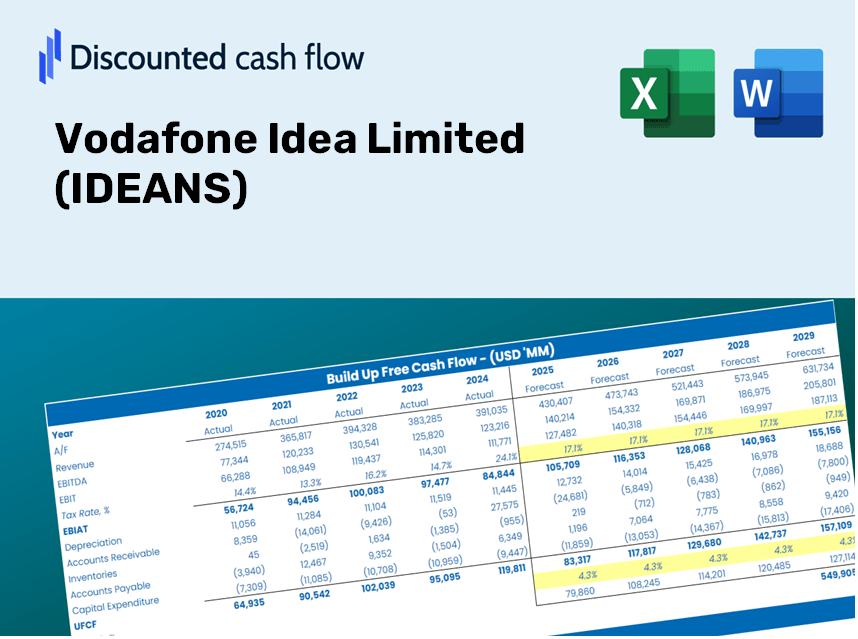
Seja você um investidor ou analista, esta calculadora DCF (Ideans) é o seu recurso preferido para uma avaliação precisa. Apresentando dados reais da Vodafone Idea Limited, você pode ajustar as previsões e observar instantaneamente os efeitos.
What You Will Receive
- Customizable Excel Template: A fully adjustable Excel-based DCF Calculator featuring pre-filled financial data for Vodafone Idea Limited (IDEANS).
- Accurate Data: Historical performance data and future projections (highlighted in the yellow cells).
- Flexible Forecasting: Easily alter forecast parameters such as revenue growth, EBITDA %, and WACC.
- Instant Calculations: Quickly observe how your inputs affect the valuation of Vodafone Idea Limited (IDEANS).
- Professional Resource: Designed for use by investors, CFOs, consultants, and financial analysts.
- User-Friendly Interface: Organized for simplicity and efficiency, complete with step-by-step guidance.
Key Features
- Customizable Forecast Inputs: Adjust essential parameters such as revenue growth, EBITDA %, and capital expenditures tailored for Vodafone Idea Limited (IDEANS).
- Instant DCF Valuation: Quickly computes intrinsic value, NPV, and additional financial metrics for Vodafone Idea Limited (IDEANS).
- High-Quality Accuracy: Leverages Vodafone Idea Limited (IDEANS) real-world financial data to ensure precise valuation results.
- Simplified Scenario Analysis: Effortlessly evaluate various assumptions and analyze different outcomes for Vodafone Idea Limited (IDEANS).
- Efficiency Booster: Avoid the hassle of constructing complicated valuation models from the ground up for Vodafone Idea Limited (IDEANS).
How It Functions
- Step 1: Download the Excel spreadsheet.
- Step 2: Examine the pre-filled financial data and forecasts provided by Vodafone Idea Limited (IDEANS).
- Step 3: Adjust key inputs such as revenue growth, WACC, and tax rates (highlighted cells).
- Step 4: Observe the DCF model refresh in real-time as you modify the assumptions.
- Step 5: Evaluate the outputs and leverage the findings for your investment decisions.
Why Opt for This Calculator?
- All-in-One Solution: Integrates DCF, WACC, and comprehensive financial ratio analyses for a complete evaluation.
- Flexible Inputs: Modify yellow-highlighted cells to explore different scenarios and outcomes.
- In-Depth Analysis: Automatically computes the intrinsic value and Net Present Value for Vodafone Idea Limited (IDEANS).
- Ready-to-Use Data: Comes with historical and projected data to provide reliable starting points for analysis.
- High Professional Standards: Perfect for financial analysts, investors, and business consultants seeking quality insights.
Who Should Use This Product?
- Finance Students: Discover valuation methodologies and apply them to real-time data.
- Academics: Integrate industry-standard models into your research or teaching materials.
- Investors: Validate your investment hypotheses and assess valuation results for Vodafone Idea Limited (IDEANS).
- Analysts: Enhance your efficiency with a ready-to-use, customizable DCF model.
- Small Business Owners: Learn how large public companies like Vodafone Idea Limited (IDEANS) are evaluated in the market.
Contents of the Template
- Pre-Filled Data: Contains Vodafone Idea Limited’s historical financials and projections.
- Discounted Cash Flow Model: Editable DCF valuation model with automatic computations.
- Weighted Average Cost of Capital (WACC): A dedicated sheet for calculating WACC using customized inputs.
- Key Financial Ratios: Evaluate Vodafone Idea Limited's profitability, efficiency, and leverage.
- Customizable Inputs: Easily modify revenue growth, margins, and tax rates.
- Clear Dashboard: Visuals and tables presenting key valuation outcomes.
Disclaimer
All information, articles, and product details provided on this website are for general informational and educational purposes only. We do not claim any ownership over, nor do we intend to infringe upon, any trademarks, copyrights, logos, brand names, or other intellectual property mentioned or depicted on this site. Such intellectual property remains the property of its respective owners, and any references here are made solely for identification or informational purposes, without implying any affiliation, endorsement, or partnership.
We make no representations or warranties, express or implied, regarding the accuracy, completeness, or suitability of any content or products presented. Nothing on this website should be construed as legal, tax, investment, financial, medical, or other professional advice. In addition, no part of this site—including articles or product references—constitutes a solicitation, recommendation, endorsement, advertisement, or offer to buy or sell any securities, franchises, or other financial instruments, particularly in jurisdictions where such activity would be unlawful.
All content is of a general nature and may not address the specific circumstances of any individual or entity. It is not a substitute for professional advice or services. Any actions you take based on the information provided here are strictly at your own risk. You accept full responsibility for any decisions or outcomes arising from your use of this website and agree to release us from any liability in connection with your use of, or reliance upon, the content or products found herein.