
|
IFB Industries Limited (ifbind.ns) Avaliação DCF |
Totalmente Editável: Adapte-Se Às Suas Necessidades No Excel Ou Planilhas
Design Profissional: Modelos Confiáveis E Padrão Da Indústria
Pré-Construídos Para Uso Rápido E Eficiente
Compatível com MAC/PC, totalmente desbloqueado
Não É Necessária Experiência; Fácil De Seguir
IFB Industries Limited (IFBIND.NS) Bundle
Avalie as perspectivas financeiras da IFB Industries Limited como um especialista! Esta calculadora DCF (ifbindns) fornece dados financeiros pré-preenchidos e a flexibilidade completa para modificar o crescimento da receita, o WACC, as margens e outras suposições essenciais para se alinhar às suas projeções.
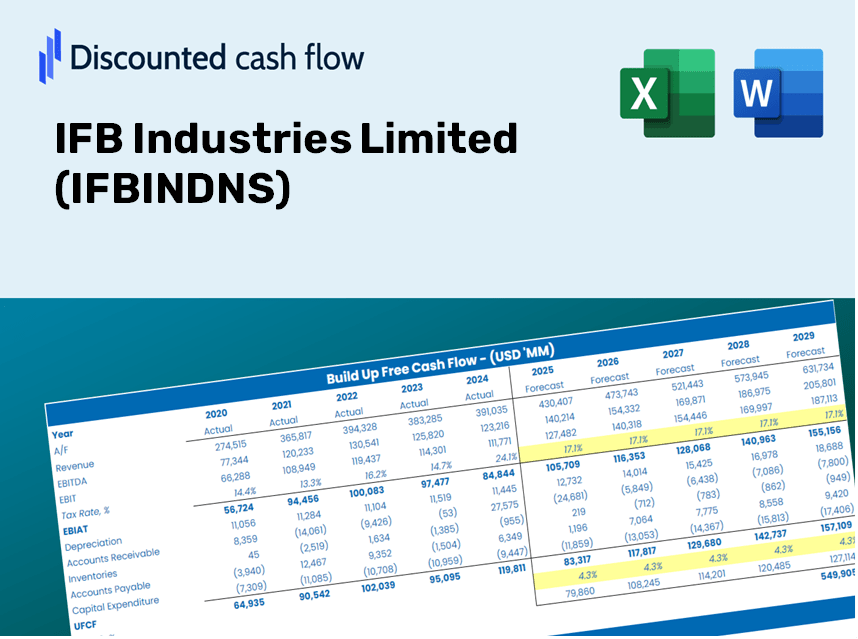
Discounted Cash Flow (DCF) - (USD MM)
| Year | AY1 2021 |
AY2 2022 |
AY3 2023 |
AY4 2024 |
AY5 2025 |
FY1 2026 |
FY2 2027 |
FY3 2028 |
FY4 2029 |
FY5 2030 |
|---|---|---|---|---|---|---|---|---|---|---|
| Revenue | 28,008.0 | 34,153.8 | 41,949.9 | 44,378.4 | 50,917.1 | 59,228.4 | 68,896.3 | 80,142.3 | 93,224.0 | 108,441.1 |
| Revenue Growth, % | 0 | 21.94 | 22.83 | 5.79 | 14.73 | 16.32 | 16.32 | 16.32 | 16.32 | 16.32 |
| EBITDA | 2,327.5 | 742.7 | 1,866.4 | 2,245.9 | 3,007.1 | 3,068.1 | 3,568.9 | 4,151.4 | 4,829.1 | 5,617.4 |
| EBITDA, % | 8.31 | 2.17 | 4.45 | 5.06 | 5.91 | 5.18 | 5.18 | 5.18 | 5.18 | 5.18 |
| Depreciation | 1,024.2 | 1,154.5 | 1,215.0 | 1,243.9 | 1,318.7 | 1,815.5 | 2,111.8 | 2,456.6 | 2,857.6 | 3,324.0 |
| Depreciation, % | 3.66 | 3.38 | 2.9 | 2.8 | 2.59 | 3.07 | 3.07 | 3.07 | 3.07 | 3.07 |
| EBIT | 1,303.3 | -411.8 | 651.4 | 1,002.0 | 1,688.4 | 1,252.6 | 1,457.1 | 1,694.9 | 1,971.5 | 2,293.4 |
| EBIT, % | 4.65 | -1.21 | 1.55 | 2.26 | 3.32 | 2.11 | 2.11 | 2.11 | 2.11 | 2.11 |
| Total Cash | 3,767.7 | 3,177.0 | 1,862.0 | 3,020.8 | 3,235.2 | 4,780.2 | 5,560.4 | 6,468.1 | 7,523.9 | 8,752.0 |
| Total Cash, percent | .0 | .0 | .0 | .0 | .0 | .0 | .0 | .0 | .0 | .0 |
| Account Receivables | 2,662.3 | 3,130.5 | 4,182.8 | 4,630.5 | 4,309.2 | 5,631.4 | 6,550.6 | 7,619.9 | 8,863.7 | 10,310.5 |
| Account Receivables, % | 9.51 | 9.17 | 9.97 | 10.43 | 8.46 | 9.51 | 9.51 | 9.51 | 9.51 | 9.51 |
| Inventories | 4,831.8 | 5,907.9 | 5,929.8 | 5,526.7 | 6,696.6 | 8,800.2 | 10,236.7 | 11,907.6 | 13,851.3 | 16,112.3 |
| Inventories, % | 17.25 | 17.3 | 14.14 | 12.45 | 13.15 | 14.86 | 14.86 | 14.86 | 14.86 | 14.86 |
| Accounts Payable | 8,119.9 | 8,119.9 | 8,250.7 | 9,832.4 | 9,433.4 | 13,399.4 | 15,586.6 | 18,130.9 | 21,090.4 | 24,533.0 |
| Accounts Payable, % | 28.99 | 23.77 | 19.67 | 22.16 | 18.53 | 22.62 | 22.62 | 22.62 | 22.62 | 22.62 |
| Capital Expenditure | -933.0 | -738.6 | -666.1 | -651.1 | -1,066.8 | -1,260.8 | -1,466.7 | -1,706.1 | -1,984.5 | -2,308.5 |
| Capital Expenditure, % | -3.33 | -2.16 | -1.59 | -1.47 | -2.1 | -2.13 | -2.13 | -2.13 | -2.13 | -2.13 |
| Tax Rate, % | 27.25 | 27.25 | 27.25 | 27.25 | 27.25 | 27.25 | 27.25 | 27.25 | 27.25 | 27.25 |
| EBITAT | 844.8 | -269.2 | 302.4 | 691.3 | 1,228.3 | 797.6 | 927.8 | 1,079.2 | 1,255.4 | 1,460.3 |
| Depreciation | ||||||||||
| Changes in Account Receivables | ||||||||||
| Changes in Inventories | ||||||||||
| Changes in Accounts Payable | ||||||||||
| Capital Expenditure | ||||||||||
| UFCF | 1,561.8 | -1,397.6 | -92.1 | 2,821.2 | 232.6 | 1,892.5 | 1,404.5 | 1,633.7 | 1,900.4 | 2,210.6 |
| WACC, % | 5.67 | 5.68 | 5.62 | 5.69 | 5.7 | 5.67 | 5.67 | 5.67 | 5.67 | 5.67 |
| PV UFCF | ||||||||||
| SUM PV UFCF | 7,635.1 | |||||||||
| Long Term Growth Rate, % | 4.00 | |||||||||
| Free cash flow (T + 1) | 2,299 | |||||||||
| Terminal Value | 137,569 | |||||||||
| Present Terminal Value | 104,409 | |||||||||
| Enterprise Value | 112,044 | |||||||||
| Net Debt | 1,408 | |||||||||
| Equity Value | 110,636 | |||||||||
| Diluted Shares Outstanding, MM | 41 | |||||||||
| Equity Value Per Share | 2,729.42 |
What You Will Receive
- Adjustable Forecast Inputs: Effortlessly modify key assumptions (growth %, margins, WACC) to generate various scenarios.
- Real-Time Data: IFB Industries Limited's financial information pre-loaded to kickstart your analysis.
- Automatic DCF Calculations: The template computes Net Present Value (NPV) and intrinsic value automatically.
- Tailored and Professional: A refined Excel model that adjusts to meet your valuation requirements.
- Designed for Analysts and Investors: Perfect for evaluating projections, confirming strategies, and optimizing efficiency.
Key Features
- Pre-Loaded Data: Historical financial statements and pre-filled forecasts for IFB Industries Limited (IFBINDNS).
- Fully Adjustable Inputs: Customize WACC, tax rates, revenue growth, and EBITDA margins as needed.
- Instant Results: View the intrinsic value of IFB Industries Limited (IFBINDNS) recalibrate in real time.
- Clear Visual Outputs: Interactive dashboard charts showcase valuation results and essential metrics.
- Built for Accuracy: A reliable tool designed for analysts, investors, and finance professionals.
How It Functions
- 1. Access the Template: Download and open the Excel file that includes IFB Industries Limited’s (IFBINDNS) preloaded data.
- 2. Adjust Parameters: Modify essential inputs such as growth rates, WACC, and capital expenditures.
- 3. See Results in Real-Time: The DCF model automatically computes intrinsic value and NPV.
- 4. Explore Scenarios: Analyze various forecasts to evaluate different valuation results.
- 5. Utilize with Assurance: Deliver expert valuation insights to bolster your decision-making process.
Why Select the IFB Industries Limited (IFBINDNS) Calculator?
- Time-Saving: Start analyzing immediately—there’s no need to build a DCF model from the ground up.
- Enhanced Accuracy: Dependable financial data and calculations minimize valuation errors.
- Completely Customizable: Adjust the model to align with your specific assumptions and forecasts.
- User-Friendly: Intuitive charts and outputs facilitate straightforward analysis of results.
- Preferred by Professionals: Crafted for experts who prioritize both precision and ease of use.
Who Can Benefit from This Product?
- Investors: Evaluate IFB Industries Limited’s valuation before making stock transactions.
- CFOs and Financial Analysts: Enhance the efficiency of valuation processes and assess forecasts.
- Startup Founders: Discover how large public firms like IFB Industries Limited are appraised.
- Consultants: Provide expert valuation reports for your clients.
- Students and Educators: Utilize real-world data to practice and instruct valuation methods.
Contents of the Template
- Operating and Balance Sheet Data: Pre-filled historical data and forecasts for IFB Industries Limited (IFBINDNS), encompassing revenue, EBITDA, EBIT, and capital expenditures.
- WACC Calculation: A specific sheet dedicated to the calculation of Weighted Average Cost of Capital (WACC), featuring inputs such as Beta, risk-free rate, and share price.
- DCF Valuation (Unlevered and Levered): Customizable Discounted Cash Flow models that provide intrinsic value along with thorough calculations.
- Financial Statements: Pre-loaded annual and quarterly financial statements tailored for analysis.
- Key Ratios: A suite of profitability, leverage, and efficiency ratios pertinent to IFB Industries Limited (IFBINDNS).
- Dashboard and Charts: A visual overview of valuation outputs and underlying assumptions, facilitating easy analysis of results.
Disclaimer
All information, articles, and product details provided on this website are for general informational and educational purposes only. We do not claim any ownership over, nor do we intend to infringe upon, any trademarks, copyrights, logos, brand names, or other intellectual property mentioned or depicted on this site. Such intellectual property remains the property of its respective owners, and any references here are made solely for identification or informational purposes, without implying any affiliation, endorsement, or partnership.
We make no representations or warranties, express or implied, regarding the accuracy, completeness, or suitability of any content or products presented. Nothing on this website should be construed as legal, tax, investment, financial, medical, or other professional advice. In addition, no part of this site—including articles or product references—constitutes a solicitation, recommendation, endorsement, advertisement, or offer to buy or sell any securities, franchises, or other financial instruments, particularly in jurisdictions where such activity would be unlawful.
All content is of a general nature and may not address the specific circumstances of any individual or entity. It is not a substitute for professional advice or services. Any actions you take based on the information provided here are strictly at your own risk. You accept full responsibility for any decisions or outcomes arising from your use of this website and agree to release us from any liability in connection with your use of, or reliance upon, the content or products found herein.