
|
Ionq, Inc. WT (IONQ-WT) Avaliação DCF |
Totalmente Editável: Adapte-Se Às Suas Necessidades No Excel Ou Planilhas
Design Profissional: Modelos Confiáveis E Padrão Da Indústria
Pré-Construídos Para Uso Rápido E Eficiente
Compatível com MAC/PC, totalmente desbloqueado
Não É Necessária Experiência; Fácil De Seguir
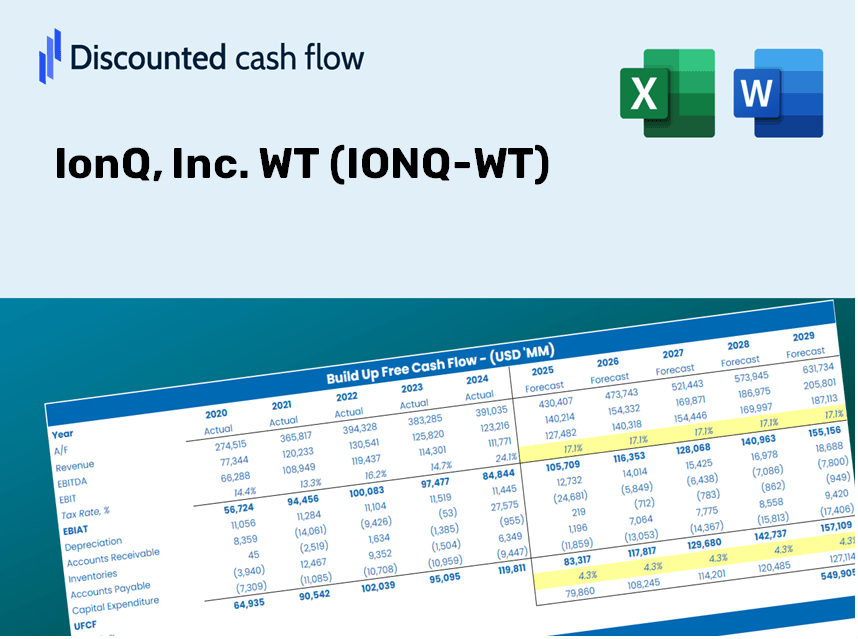
IonQ, Inc. WT (IONQ-WT) Bundle
Simplifique sua análise e melhore a precisão com a nossa calculadora DCF (IONQ-WT)! Utilizando dados reais do IONQ e suposições personalizáveis, essa ferramenta o capacita a prever, analisar e avaliar a IONQ, Inc. como um investidor profissional experiente.
Discounted Cash Flow (DCF) - (USD MM)
| Year | AY1 2020 |
AY2 2021 |
AY3 2022 |
AY4 2023 |
AY5 2024 |
FY1 2025 |
FY2 2026 |
FY3 2027 |
FY4 2028 |
FY5 2029 |
|---|---|---|---|---|---|---|---|---|---|---|
| Revenue | .0 | 2.1 | 11.1 | 22.0 | 43.1 | 74.7 | 129.4 | 224.4 | 389.0 | 674.4 |
| Revenue Growth, % | 0 | 0 | 430.3 | 98.02 | 95.41 | 73.36 | 73.36 | 73.36 | 73.36 | 73.36 |
| EBITDA | -14.0 | -103.6 | -42.9 | -147.3 | -312.9 | -44.8 | -77.7 | -134.6 | -233.4 | -404.7 |
| EBITDA, % | 100 | -4937.49 | -385.47 | -668.49 | -726.52 | -60 | -60 | -60 | -60 | -60 |
| Depreciation | 1.4 | 2.5 | 5.6 | 10.4 | 18.7 | 50.9 | 88.2 | 152.9 | 265.1 | 459.6 |
| Depreciation, % | 100 | 121.39 | 50.35 | 47.07 | 43.31 | 68.14 | 68.14 | 68.14 | 68.14 | 68.14 |
| EBIT | -15.4 | -106.2 | -48.5 | -157.7 | -331.6 | -44.8 | -77.7 | -134.6 | -233.4 | -404.7 |
| EBIT, % | 100 | -5058.89 | -435.82 | -715.56 | -769.83 | -60 | -60 | -60 | -60 | -60 |
| Total Cash | 36.1 | 522.5 | 355.8 | 355.4 | 340.3 | 74.7 | 129.4 | 224.4 | 389.0 | 674.4 |
| Total Cash, percent | .0 | .0 | .0 | .0 | .0 | .0 | .0 | .0 | .0 | .0 |
| Account Receivables | .4 | .7 | 3.3 | 13.6 | 12.4 | 37.9 | 65.7 | 113.8 | 197.4 | 342.2 |
| Account Receivables, % | 100 | 33.68 | 29.58 | 61.59 | 28.81 | 50.73 | 50.73 | 50.73 | 50.73 | 50.73 |
| Inventories | .0 | .0 | 5.2 | 12.5 | 18.7 | 36.8 | 63.8 | 110.6 | 191.6 | 332.2 |
| Inventories, % | 100 | 0 | 46.39 | 56.6 | 43.32 | 49.26 | 49.26 | 49.26 | 49.26 | 49.26 |
| Accounts Payable | .5 | 1.9 | 3.1 | 5.6 | 5.2 | 38.0 | 65.9 | 114.3 | 198.1 | 343.5 |
| Accounts Payable, % | 100 | 89.66 | 27.45 | 25.4 | 12.14 | 50.93 | 50.93 | 50.93 | 50.93 | 50.93 |
| Capital Expenditure | -11.7 | -10.0 | -12.6 | -19.5 | -23.6 | -51.3 | -88.9 | -154.1 | -267.2 | -463.2 |
| Capital Expenditure, % | 100 | -477.56 | -112.87 | -88.69 | -54.72 | -68.68 | -68.68 | -68.68 | -68.68 | -68.68 |
| Tax Rate, % | -0.01779317 | -0.01779317 | -0.01779317 | -0.01779317 | -0.01779317 | -0.01779317 | -0.01779317 | -0.01779317 | -0.01779317 | -0.01779317 |
| EBITAT | -15.4 | -106.2 | -48.5 | -157.8 | -331.6 | -44.8 | -77.7 | -134.6 | -233.4 | -404.7 |
| Depreciation | ||||||||||
| Changes in Account Receivables | ||||||||||
| Changes in Inventories | ||||||||||
| Changes in Accounts Payable | ||||||||||
| Capital Expenditure | ||||||||||
| UFCF | -25.6 | -112.6 | -62.0 | -182.0 | -341.9 | -56.0 | -105.2 | -182.4 | -316.3 | -548.3 |
| WACC, % | 15.99 | 15.99 | 15.99 | 15.99 | 15.99 | 15.99 | 15.99 | 15.99 | 15.99 | 15.99 |
| PV UFCF | ||||||||||
| SUM PV UFCF | -679.4 | |||||||||
| Long Term Growth Rate, % | 2.00 | |||||||||
| Free cash flow (T + 1) | -559 | |||||||||
| Terminal Value | -3,998 | |||||||||
| Present Terminal Value | -1,905 | |||||||||
| Enterprise Value | -2,584 | |||||||||
| Net Debt | -37 | |||||||||
| Equity Value | -2,547 | |||||||||
| Diluted Shares Outstanding, MM | 213 | |||||||||
| Equity Value Per Share | -11.96 |
What You Will Receive
- Customizable Excel Template: A comprehensive Excel-based DCF Calculator featuring pre-filled financials for IonQ, Inc. (IONQ-WT).
- Actual Market Data: Access to historical performance data and projected estimates (displayed in the highlighted cells).
- Adjustable Forecasts: Modify key assumptions such as revenue growth, EBITDA percentage, and WACC.
- Real-Time Calculations: Instantly observe how your inputs influence the valuation of IonQ, Inc. (IONQ-WT).
- Professional Software: Designed for investors, CFOs, consultants, and financial analysts alike.
- User-Centric Layout: Organized for simplicity and functionality, complete with detailed instructions.
Key Features
- Advanced DCF Calculator: Features comprehensive unlevered and levered DCF valuation models tailored for IonQ, Inc. (IONQ-WT).
- WACC Calculator: Comes with a pre-configured Weighted Average Cost of Capital sheet that allows for customizable inputs specific to IonQ, Inc. (IONQ-WT).
- Editable Forecast Assumptions: Adjust growth rates, capital expenditures, and discount rates to suit the needs of IonQ, Inc. (IONQ-WT).
- Built-In Financial Ratios: Evaluate profitability, leverage, and efficiency ratios for IonQ, Inc. (IONQ-WT).
- Dashboard and Charts: Visual representations that summarize key valuation metrics for IonQ, Inc. (IONQ-WT) for straightforward analysis.
How It Functions
- Download the Template: Gain immediate access to the Excel-based IONQ-WT DCF Calculator.
- Input Your Assumptions: Modify the yellow-highlighted cells for growth rates, WACC, margins, and additional parameters.
- Instant Calculations: The model automatically refreshes IONQ's intrinsic value based on your inputs.
- Test Scenarios: Experiment with various assumptions to assess potential changes in valuation.
- Analyze and Decide: Utilize the results to inform your investment or financial evaluations.
Why Opt for This Calculator?
- Precise Information: Authentic IonQ financials guarantee trustworthy valuation outcomes.
- Tailorable: Modify essential parameters such as growth rates, WACC, and tax rates to align with your forecasts.
- Efficient: Ready-made calculations save you the hassle of starting from square one.
- Professional-Quality Tool: Crafted for investors, analysts, and consultants alike.
- Easy to Navigate: User-friendly design and clear, step-by-step guidance simplify the process for everyone.
Who Can Benefit from IonQ, Inc. WT (IONQ-WT)?
- Investors: Make informed decisions with a cutting-edge quantum computing platform.
- Data Scientists: Enhance your analyses with powerful quantum algorithms and tools designed for customization.
- Consultants: Efficiently modify solutions for client meetings or strategic reports.
- Tech Enthusiasts: Expand your knowledge of quantum computing principles through hands-on experience and case studies.
- Educators and Students: Utilize it as a practical resource in quantum computing and technology courses.
What the Template Includes
- Comprehensive DCF Model: An editable template featuring in-depth valuation calculations.
- Real-World Data: IonQ, Inc.'s historical and projected financial data preloaded for your analysis.
- Customizable Parameters: Modify WACC, growth rates, and tax assumptions to explore various scenarios.
- Financial Statements: Complete annual and quarterly financial breakdowns for enhanced insights.
- Key Ratios: Integrated analysis for profitability, efficiency, and leverage metrics.
- Dashboard with Visual Outputs: Interactive charts and tables providing clear and actionable results.
Disclaimer
All information, articles, and product details provided on this website are for general informational and educational purposes only. We do not claim any ownership over, nor do we intend to infringe upon, any trademarks, copyrights, logos, brand names, or other intellectual property mentioned or depicted on this site. Such intellectual property remains the property of its respective owners, and any references here are made solely for identification or informational purposes, without implying any affiliation, endorsement, or partnership.
We make no representations or warranties, express or implied, regarding the accuracy, completeness, or suitability of any content or products presented. Nothing on this website should be construed as legal, tax, investment, financial, medical, or other professional advice. In addition, no part of this site—including articles or product references—constitutes a solicitation, recommendation, endorsement, advertisement, or offer to buy or sell any securities, franchises, or other financial instruments, particularly in jurisdictions where such activity would be unlawful.
All content is of a general nature and may not address the specific circumstances of any individual or entity. It is not a substitute for professional advice or services. Any actions you take based on the information provided here are strictly at your own risk. You accept full responsibility for any decisions or outcomes arising from your use of this website and agree to release us from any liability in connection with your use of, or reliance upon, the content or products found herein.