
|
Ingersoll Rand Inc. (IR) Avaliação DCF |
Totalmente Editável: Adapte-Se Às Suas Necessidades No Excel Ou Planilhas
Design Profissional: Modelos Confiáveis E Padrão Da Indústria
Pré-Construídos Para Uso Rápido E Eficiente
Compatível com MAC/PC, totalmente desbloqueado
Não É Necessária Experiência; Fácil De Seguir
Ingersoll Rand Inc. (IR) Bundle
Obtenha informações sobre sua análise de avaliação Ingersoll Rand Inc. (IR) usando nossa sofisticada calculadora DCF! Pré -carregado com dados reais (IR), este modelo do Excel permite ajustar as previsões e suposições para determinar com precisão o valor intrínseco da Ingersoll Rand Inc.
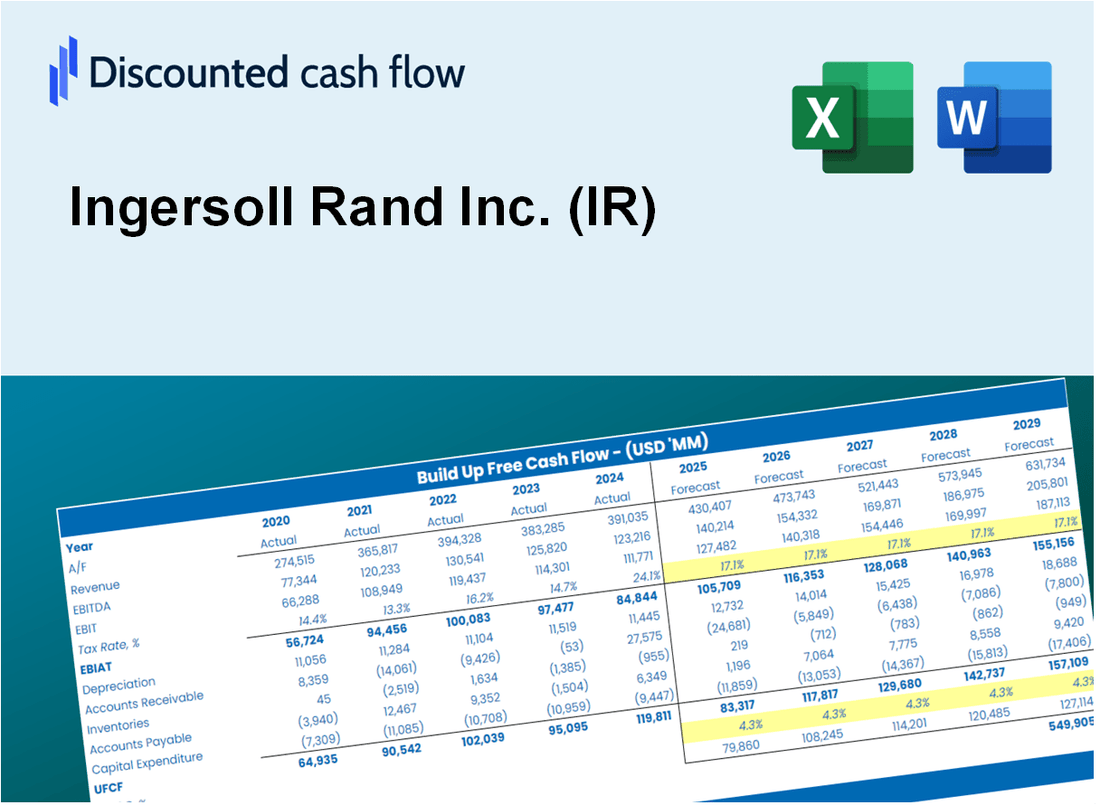
Discounted Cash Flow (DCF) - (USD MM)
| Year | AY1 2020 |
AY2 2021 |
AY3 2022 |
AY4 2023 |
AY5 2024 |
FY1 2025 |
FY2 2026 |
FY3 2027 |
FY4 2028 |
FY5 2029 |
|---|---|---|---|---|---|---|---|---|---|---|
| Revenue | 3,973.2 | 5,152.4 | 5,916.3 | 6,876.1 | 7,235.0 | 8,427.8 | 9,817.3 | 11,435.9 | 13,321.3 | 15,517.6 |
| Revenue Growth, % | 0 | 29.68 | 14.83 | 16.22 | 5.22 | 16.49 | 16.49 | 16.49 | 16.49 | 16.49 |
| EBITDA | 478.2 | 1,022.8 | 1,278.2 | 1,646.9 | 1,828.0 | 1,731.2 | 2,016.6 | 2,349.1 | 2,736.4 | 3,187.6 |
| EBITDA, % | 12.04 | 19.85 | 21.6 | 23.95 | 25.27 | 20.54 | 20.54 | 20.54 | 20.54 | 20.54 |
| Depreciation | 412.5 | 422.1 | 432.8 | 459.1 | 482.0 | 661.2 | 770.2 | 897.2 | 1,045.1 | 1,217.5 |
| Depreciation, % | 10.38 | 8.19 | 7.32 | 6.68 | 6.66 | 7.85 | 7.85 | 7.85 | 7.85 | 7.85 |
| EBIT | 65.7 | 600.7 | 845.4 | 1,187.8 | 1,346.0 | 1,070.0 | 1,246.4 | 1,451.9 | 1,691.3 | 1,970.1 |
| EBIT, % | 1.65 | 11.66 | 14.29 | 17.27 | 18.6 | 12.7 | 12.7 | 12.7 | 12.7 | 12.7 |
| Total Cash | 1,750.9 | 2,109.6 | 1,613.0 | 1,595.5 | 1,541.2 | 2,642.6 | 3,078.3 | 3,585.9 | 4,177.1 | 4,865.7 |
| Total Cash, percent | .0 | .0 | .0 | .0 | .0 | .0 | .0 | .0 | .0 | .0 |
| Account Receivables | 861.8 | 948.6 | 1,122.0 | 1,234.2 | 1,335.4 | 1,609.2 | 1,874.6 | 2,183.6 | 2,543.6 | 2,963.0 |
| Account Receivables, % | 21.69 | 18.41 | 18.96 | 17.95 | 18.46 | 19.09 | 19.09 | 19.09 | 19.09 | 19.09 |
| Inventories | 716.7 | 854.2 | 1,025.4 | 1,001.1 | 1,055.0 | 1,366.8 | 1,592.2 | 1,854.7 | 2,160.4 | 2,516.6 |
| Inventories, % | 18.04 | 16.58 | 17.33 | 14.56 | 14.58 | 16.22 | 16.22 | 16.22 | 16.22 | 16.22 |
| Accounts Payable | 536.4 | 670.5 | 778.7 | 801.2 | 843.6 | 1,061.7 | 1,236.7 | 1,440.6 | 1,678.2 | 1,954.8 |
| Accounts Payable, % | 13.5 | 13.01 | 13.16 | 11.65 | 11.66 | 12.6 | 12.6 | 12.6 | 12.6 | 12.6 |
| Capital Expenditure | -48.7 | -64.1 | -94.6 | -105.4 | -149.1 | -129.2 | -150.4 | -175.3 | -204.1 | -237.8 |
| Capital Expenditure, % | -1.23 | -1.24 | -1.6 | -1.53 | -2.06 | -1.53 | -1.53 | -1.53 | -1.53 | -1.53 |
| Tax Rate, % | 24.37 | 24.37 | 24.37 | 24.37 | 24.37 | 24.37 | 24.37 | 24.37 | 24.37 | 24.37 |
| EBITAT | 48.2 | 658.7 | 688.8 | 897.0 | 1,018.0 | 868.8 | 1,012.0 | 1,178.9 | 1,373.2 | 1,599.6 |
| Depreciation | ||||||||||
| Changes in Account Receivables | ||||||||||
| Changes in Inventories | ||||||||||
| Changes in Accounts Payable | ||||||||||
| Capital Expenditure | ||||||||||
| UFCF | -630.1 | 926.5 | 790.6 | 1,185.3 | 1,238.2 | 1,033.3 | 1,316.2 | 1,533.2 | 1,786.0 | 2,080.4 |
| WACC, % | 9.45 | 9.61 | 9.5 | 9.47 | 9.47 | 9.5 | 9.5 | 9.5 | 9.5 | 9.5 |
| PV UFCF | ||||||||||
| SUM PV UFCF | 5,773.0 | |||||||||
| Long Term Growth Rate, % | 3.00 | |||||||||
| Free cash flow (T + 1) | 2,143 | |||||||||
| Terminal Value | 32,970 | |||||||||
| Present Terminal Value | 20,944 | |||||||||
| Enterprise Value | 26,718 | |||||||||
| Net Debt | 3,439 | |||||||||
| Equity Value | 23,279 | |||||||||
| Diluted Shares Outstanding, MM | 407 | |||||||||
| Equity Value Per Share | 57.17 |
What You Will Get
- Editable Forecast Inputs: Easily modify assumptions (growth %, margins, WACC) to explore various scenarios.
- Real-World Data: Ingersoll Rand Inc.’s (IR) financial data pre-loaded to facilitate your analysis.
- Automatic DCF Outputs: The template computes Net Present Value (NPV) and intrinsic value automatically.
- Customizable and Professional: A sleek Excel model that tailors to your valuation requirements.
- Built for Analysts and Investors: Perfect for evaluating projections, confirming strategies, and enhancing efficiency.
Key Features
- Real-Life IR Data: Pre-filled with Ingersoll Rand's historical financials and forward-looking projections.
- Fully Customizable Inputs: Adjust revenue growth, margins, WACC, tax rates, and capital expenditures.
- Dynamic Valuation Model: Automatic updates to Net Present Value (NPV) and intrinsic value based on your inputs.
- Scenario Testing: Create multiple forecast scenarios to analyze different valuation outcomes.
- User-Friendly Design: Simple, structured, and designed for professionals and beginners alike.
How It Works
- 1. Download the Template: Obtain and open the Excel file containing Ingersoll Rand Inc.'s (IR) preloaded data.
- 2. Adjust Key Assumptions: Modify essential inputs such as growth rates, WACC, and capital expenditures.
- 3. Instant Results: The DCF model automatically computes intrinsic value and NPV in real-time.
- 4. Explore Different Scenarios: Analyze various forecasts to evaluate alternative valuation results.
- 5. Present with Assurance: Share expert valuation insights to enhance your decision-making process.
Why Choose This Calculator for Ingersoll Rand Inc. (IR)?
- Designed for Experts: A sophisticated tool utilized by financial analysts, CFOs, and industry consultants.
- Accurate Data: Ingersoll Rand's historical and anticipated financials are preloaded for precision.
- Flexible Scenario Analysis: Effortlessly simulate various forecasts and assumptions.
- Comprehensive Outputs: Automatically computes intrinsic value, NPV, and essential financial metrics.
- User-Friendly: Step-by-step guidance ensures a smooth experience throughout the process.
Who Should Use This Product?
- Investors: Accurately assess Ingersoll Rand Inc.'s (IR) fair value before making investment choices.
- CFOs: Utilize a professional-grade DCF model for comprehensive financial reporting and analysis.
- Consultants: Effortlessly customize the template for client valuation reports.
- Entrepreneurs: Acquire insights into the financial modeling practices of leading companies.
- Educators: Employ it as an educational resource to illustrate valuation methodologies.
What the Template Contains
- Historical Data: Includes Ingersoll Rand Inc.'s (IR) past financials and baseline forecasts.
- DCF and Levered DCF Models: Detailed templates to calculate Ingersoll Rand Inc.'s (IR) intrinsic value.
- WACC Sheet: Pre-built calculations for Weighted Average Cost of Capital.
- Editable Inputs: Modify key drivers like growth rates, EBITDA %, and CAPEX assumptions.
- Quarterly and Annual Statements: A complete breakdown of Ingersoll Rand Inc.'s (IR) financials.
- Interactive Dashboard: Visualize valuation results and projections dynamically.
Disclaimer
All information, articles, and product details provided on this website are for general informational and educational purposes only. We do not claim any ownership over, nor do we intend to infringe upon, any trademarks, copyrights, logos, brand names, or other intellectual property mentioned or depicted on this site. Such intellectual property remains the property of its respective owners, and any references here are made solely for identification or informational purposes, without implying any affiliation, endorsement, or partnership.
We make no representations or warranties, express or implied, regarding the accuracy, completeness, or suitability of any content or products presented. Nothing on this website should be construed as legal, tax, investment, financial, medical, or other professional advice. In addition, no part of this site—including articles or product references—constitutes a solicitation, recommendation, endorsement, advertisement, or offer to buy or sell any securities, franchises, or other financial instruments, particularly in jurisdictions where such activity would be unlawful.
All content is of a general nature and may not address the specific circumstances of any individual or entity. It is not a substitute for professional advice or services. Any actions you take based on the information provided here are strictly at your own risk. You accept full responsibility for any decisions or outcomes arising from your use of this website and agree to release us from any liability in connection with your use of, or reliance upon, the content or products found herein.