
|
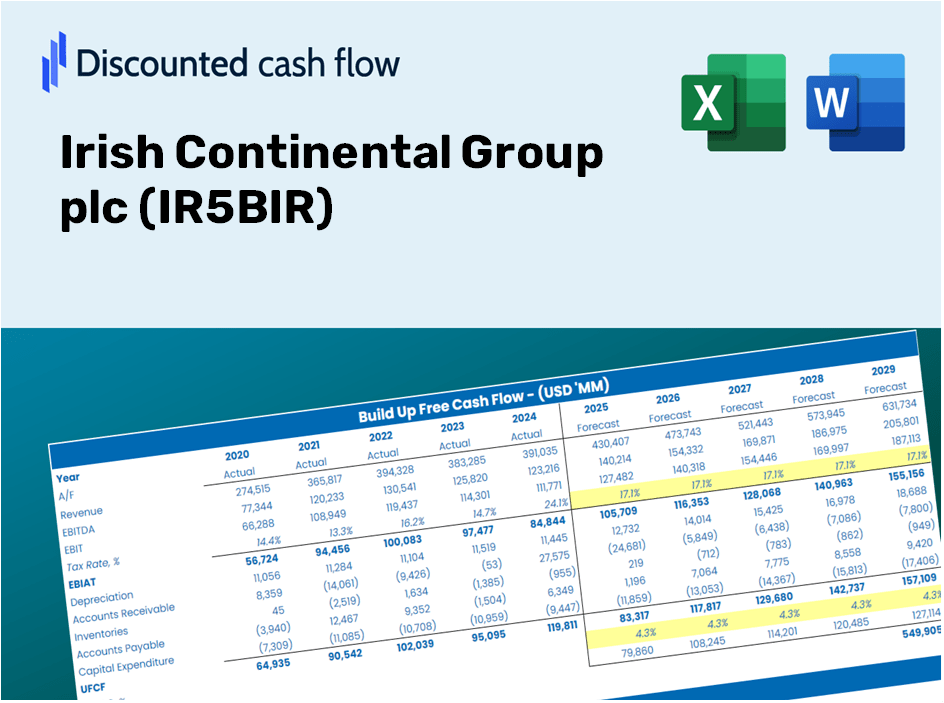
Irish Continental Group plc (IR5B.IR) DCF Valuation |
Totalmente Editável: Adapte-Se Às Suas Necessidades No Excel Ou Planilhas
Design Profissional: Modelos Confiáveis E Padrão Da Indústria
Pré-Construídos Para Uso Rápido E Eficiente
Compatível com MAC/PC, totalmente desbloqueado
Não É Necessária Experiência; Fácil De Seguir
Irish Continental Group plc (IR5B.IR) Bundle
Gain insight into your Irish Continental Group plc (IR5BIR) valuation analysis using our cutting-edge DCF Calculator! This Excel template comes preloaded with real (IR5BIR) data, enabling you to adjust forecasts and assumptions to accurately determine the intrinsic value of Irish Continental Group plc.
Discounted Cash Flow (DCF) - (USD MM)
| Year | AY1 2021 |
AY2 2022 |
AY3 2023 |
AY4 2024 |
AY5 2025 |
FY1 2026 |
FY2 2027 |
FY3 2028 |
FY4 2029 |
FY5 2030 |
|---|---|---|---|---|---|---|---|---|---|---|
| Revenue | 334.5 | 584.9 | 572.0 | 603.8 | 666.7 | 814.4 | 994.9 | 1,215.3 | 1,484.6 | 1,813.5 |
| Revenue Growth, % | 0 | 74.86 | -2.21 | 5.56 | 10.42 | 22.16 | 22.16 | 22.16 | 22.16 | 22.16 |
| EBITDA | 52.4 | 127.3 | 134.0 | 135.1 | 150.6 | 172.4 | 210.6 | 257.2 | 314.2 | 383.8 |
| EBITDA, % | 15.67 | 21.76 | 23.43 | 22.37 | 22.59 | 21.16 | 21.16 | 21.16 | 21.16 | 21.16 |
| Depreciation | 52.5 | 60.5 | 64.2 | 64.4 | 65.0 | 93.9 | 114.8 | 140.2 | 171.3 | 209.2 |
| Depreciation, % | 15.7 | 10.34 | 11.22 | 10.67 | 9.75 | 11.54 | 11.54 | 11.54 | 11.54 | 11.54 |
| EBIT | -.1 | 66.8 | 69.8 | 70.7 | 85.6 | 78.4 | 95.8 | 117.0 | 142.9 | 174.6 |
| EBIT, % | -0.02989537 | 11.42 | 12.2 | 11.71 | 12.84 | 9.63 | 9.63 | 9.63 | 9.63 | 9.63 |
| Total Cash | 38.5 | 39.0 | 46.8 | 41.3 | 36.7 | 63.0 | 77.0 | 94.1 | 114.9 | 140.4 |
| Total Cash, percent | .0 | .0 | .0 | .0 | .0 | .0 | .0 | .0 | .0 | .0 |
| Account Receivables | 48.5 | 65.5 | 61.5 | 68.5 | 82.6 | 98.0 | 119.8 | 146.3 | 178.7 | 218.3 |
| Account Receivables, % | 14.5 | 11.2 | 10.75 | 11.34 | 12.39 | 12.04 | 12.04 | 12.04 | 12.04 | 12.04 |
| Inventories | 3.8 | 5.2 | 4.0 | 11.1 | 13.1 | 10.6 | 13.0 | 15.9 | 19.4 | 23.7 |
| Inventories, % | 1.14 | 0.88904 | 0.6993 | 1.84 | 1.96 | 1.31 | 1.31 | 1.31 | 1.31 | 1.31 |
| Accounts Payable | 30.7 | 37.1 | 52.3 | 106.3 | 131.0 | 100.9 | 123.2 | 150.5 | 183.8 | 224.6 |
| Accounts Payable, % | 9.18 | 6.34 | 9.14 | 17.61 | 19.65 | 12.38 | 12.38 | 12.38 | 12.38 | 12.38 |
| Capital Expenditure | -55.5 | -75.7 | -51.3 | -29.9 | -102.0 | -95.7 | -116.9 | -142.8 | -174.5 | -213.1 |
| Capital Expenditure, % | -16.59 | -12.94 | -8.97 | -4.95 | -15.3 | -11.75 | -11.75 | -11.75 | -11.75 | -11.75 |
| Tax Rate, % | 3.35 | 3.35 | 3.35 | 3.35 | 3.35 | 3.35 | 3.35 | 3.35 | 3.35 | 3.35 |
| EBITAT | -.1 | 63.9 | 67.9 | 68.1 | 82.7 | 76.2 | 93.1 | 113.7 | 138.9 | 169.7 |
| Depreciation | ||||||||||
| Changes in Account Receivables | ||||||||||
| Changes in Inventories | ||||||||||
| Changes in Accounts Payable | ||||||||||
| Capital Expenditure | ||||||||||
| UFCF | -24.7 | 36.7 | 101.2 | 142.5 | 54.3 | 31.4 | 89.2 | 109.0 | 133.1 | 162.6 |
| WACC, % | 5.11 | 5.07 | 5.09 | 5.08 | 5.08 | 5.09 | 5.09 | 5.09 | 5.09 | 5.09 |
| PV UFCF | ||||||||||
| SUM PV UFCF | 440.7 | |||||||||
| Long Term Growth Rate, % | 3.00 | |||||||||
| Free cash flow (T + 1) | 168 | |||||||||
| Terminal Value | 8,033 | |||||||||
| Present Terminal Value | 6,269 | |||||||||
| Enterprise Value | 6,709 | |||||||||
| Net Debt | 256 | |||||||||
| Equity Value | 6,453 | |||||||||
| Diluted Shares Outstanding, MM | 164 | |||||||||
| Equity Value Per Share | 39.47 |
What You Will Receive
- Authentic IR5BIR Financial Data: Pre-loaded with Irish Continental Group's historical and forecasted data for accurate analysis.
- Completely Customizable Template: Easily adjust key inputs such as revenue growth, WACC, and EBITDA percentage.
- Instant Calculations: Watch the intrinsic value of Irish Continental Group update in real-time as you make modifications.
- Professional Valuation Tool: Crafted for investors, analysts, and consultants who seek reliable DCF outcomes.
- Intuitive Design: User-friendly layout with straightforward instructions suitable for all skill levels.
Key Features
- Real Irish Continental Group Financials: Access accurate pre-loaded historical data and future projections for Irish Continental Group plc (IR5BIR).
- Customizable Forecast Assumptions: Modify yellow-highlighted cells such as WACC, growth rates, and margins to suit your analysis.
- Dynamic Calculations: Enjoy automatic updates for DCF, Net Present Value (NPV), and cash flow analysis.
- Visual Dashboard: Utilize easy-to-read charts and summaries to help visualize your valuation results.
- For Professionals and Beginners: A user-friendly layout designed for investors, CFOs, and consultants alike.
How It Functions
- Download the Template: Gain immediate access to the Excel-based IR5BIR DCF Calculator.
- Input Your Assumptions: Modify the yellow-highlighted cells for growth rates, WACC, profit margins, and more.
- Instant Calculations: The model automatically calculates the intrinsic value of Irish Continental Group plc.
- Test Scenarios: Experiment with various assumptions to assess potential changes in valuation.
- Analyze and Decide: Utilize the results to inform your investment or financial analysis.
Why Choose This Calculator?
- Designed for Experts: A sophisticated tool favored by analysts, CFOs, and consultants.
- Data You Can Trust: Historical and projected financial information for Irish Continental Group plc (IR5BIR) preloaded for precision.
- Flexible Scenario Analysis: Effortlessly simulate various forecasts and assumptions.
- Comprehensive Outputs: Automatically determines intrinsic value, NPV, and essential metrics.
- User-Friendly: Step-by-step guidance makes the process straightforward.
Who Can Benefit from This Product?
- Professional Investors: Develop comprehensive and accurate valuation models for in-depth portfolio analysis.
- Corporate Finance Teams: Examine valuation scenarios to inform and shape internal strategies.
- Consultants and Advisors: Deliver precise valuation insights for Irish Continental Group plc (IR5BIR) to your clients.
- Students and Educators: Utilize real-world data to practice and instruct on financial modeling techniques.
- Transport Industry Enthusiasts: Gain insights into how companies like Irish Continental Group plc (IR5BIR) are appraised in the market.
Contents of the Template
- Pre-Filled DCF Model: Irish Continental Group plc's (IR5BIR) financial data preloaded for immediate application.
- WACC Calculator: Comprehensive calculations for Weighted Average Cost of Capital.
- Financial Ratios: Assess Irish Continental Group plc's (IR5BIR) profitability, leverage, and efficiency.
- Editable Inputs: Modify assumptions such as growth rates, margins, and CAPEX to tailor to your analysis.
- Financial Statements: Access annual and quarterly reports to facilitate in-depth analysis.
- Interactive Dashboard: Effortlessly visualize essential valuation metrics and outcomes.
Disclaimer
All information, articles, and product details provided on this website are for general informational and educational purposes only. We do not claim any ownership over, nor do we intend to infringe upon, any trademarks, copyrights, logos, brand names, or other intellectual property mentioned or depicted on this site. Such intellectual property remains the property of its respective owners, and any references here are made solely for identification or informational purposes, without implying any affiliation, endorsement, or partnership.
We make no representations or warranties, express or implied, regarding the accuracy, completeness, or suitability of any content or products presented. Nothing on this website should be construed as legal, tax, investment, financial, medical, or other professional advice. In addition, no part of this site—including articles or product references—constitutes a solicitation, recommendation, endorsement, advertisement, or offer to buy or sell any securities, franchises, or other financial instruments, particularly in jurisdictions where such activity would be unlawful.
All content is of a general nature and may not address the specific circumstances of any individual or entity. It is not a substitute for professional advice or services. Any actions you take based on the information provided here are strictly at your own risk. You accept full responsibility for any decisions or outcomes arising from your use of this website and agree to release us from any liability in connection with your use of, or reliance upon, the content or products found herein.