
|
Ircon International Limited (Ircon.NS) Avaliação DCF |
Totalmente Editável: Adapte-Se Às Suas Necessidades No Excel Ou Planilhas
Design Profissional: Modelos Confiáveis E Padrão Da Indústria
Pré-Construídos Para Uso Rápido E Eficiente
Compatível com MAC/PC, totalmente desbloqueado
Não É Necessária Experiência; Fácil De Seguir
Ircon International Limited (IRCON.NS) Bundle
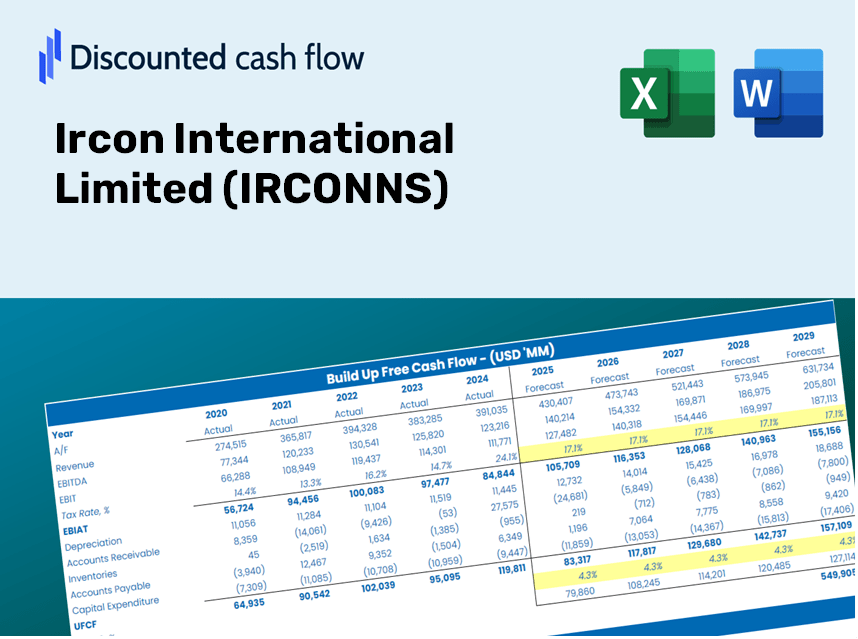
Avalie as perspectivas financeiras da Ircon International Limited (Irconns) como um especialista! Essa calculadora DCF (IRCONNS) fornece dados financeiros pré-preenchidos, juntamente com a flexibilidade para modificar o crescimento da receita, WACC, margens e outras suposições essenciais para se alinhar com suas previsões.
Discounted Cash Flow (DCF) - (USD MM)
| Year | AY1 2021 |
AY2 2022 |
AY3 2023 |
AY4 2024 |
AY5 2025 |
FY1 2026 |
FY2 2027 |
FY3 2028 |
FY4 2029 |
FY5 2030 |
|---|---|---|---|---|---|---|---|---|---|---|
| Revenue | 53,295.3 | 73,574.5 | 103,679.3 | 123,309.1 | 107,595.8 | 130,502.5 | 158,285.9 | 191,984.2 | 232,856.9 | 282,431.1 |
| Revenue Growth, % | 0 | 38.05 | 40.92 | 18.93 | -12.74 | 21.29 | 21.29 | 21.29 | 21.29 | 21.29 |
| EBITDA | 6,517.6 | 7,799.9 | 10,670.3 | 14,497.1 | 8,448.1 | 13,763.0 | 16,693.0 | 20,246.9 | 24,557.4 | 29,785.5 |
| EBITDA, % | 12.23 | 10.6 | 10.29 | 11.76 | 7.85 | 10.55 | 10.55 | 10.55 | 10.55 | 10.55 |
| Depreciation | 851.6 | 844.4 | 946.3 | 886.1 | 1,178.8 | 1,428.3 | 1,732.4 | 2,101.3 | 2,548.6 | 3,091.2 |
| Depreciation, % | 1.6 | 1.15 | 0.91272 | 0.7186 | 1.1 | 1.09 | 1.09 | 1.09 | 1.09 | 1.09 |
| EBIT | 5,666.0 | 6,955.5 | 9,724.0 | 13,611.0 | 7,269.3 | 12,334.6 | 14,960.6 | 18,145.6 | 22,008.8 | 26,694.3 |
| EBIT, % | 10.63 | 9.45 | 9.38 | 11.04 | 6.76 | 9.45 | 9.45 | 9.45 | 9.45 | 9.45 |
| Total Cash | 34,499.6 | 55,217.5 | 52,474.6 | 55,039.1 | 51,923.3 | 73,939.5 | 89,681.0 | 108,773.6 | 131,931.1 | 160,018.6 |
| Total Cash, percent | .0 | .0 | .0 | .0 | .0 | .0 | .0 | .0 | .0 | .0 |
| Account Receivables | 26,343.5 | 11,994.1 | 18,037.5 | 19,717.6 | 13,298.2 | 29,096.4 | 35,290.9 | 42,804.2 | 51,917.1 | 62,970.0 |
| Account Receivables, % | 49.43 | 16.3 | 17.4 | 15.99 | 12.36 | 22.3 | 22.3 | 22.3 | 22.3 | 22.3 |
| Inventories | 1,206.5 | 2,765.9 | 1,889.8 | 2,374.4 | 908.3 | 2,770.7 | 3,360.6 | 4,076.1 | 4,943.8 | 5,996.4 |
| Inventories, % | 2.26 | 3.76 | 1.82 | 1.93 | 0.84418 | 2.12 | 2.12 | 2.12 | 2.12 | 2.12 |
| Accounts Payable | 7,580.2 | 10,272.4 | 8,553.9 | 8,874.1 | 12,573.0 | 14,438.1 | 17,511.9 | 21,240.1 | 25,762.0 | 31,246.6 |
| Accounts Payable, % | 14.22 | 13.96 | 8.25 | 7.2 | 11.69 | 11.06 | 11.06 | 11.06 | 11.06 | 11.06 |
| Capital Expenditure | -45.6 | -408.8 | -997.6 | -8,483.0 | -10,520.7 | -4,766.2 | -5,780.9 | -7,011.6 | -8,504.3 | -10,314.9 |
| Capital Expenditure, % | -0.08556102 | -0.55563 | -0.9622 | -6.88 | -9.78 | -3.65 | -3.65 | -3.65 | -3.65 | -3.65 |
| Tax Rate, % | 22.54 | 22.54 | 22.54 | 22.54 | 22.54 | 22.54 | 22.54 | 22.54 | 22.54 | 22.54 |
| EBITAT | 3,836.7 | 5,982.8 | 8,351.4 | 10,032.6 | 5,631.1 | 9,640.4 | 11,692.8 | 14,182.2 | 17,201.5 | 20,863.6 |
| Depreciation | ||||||||||
| Changes in Account Receivables | ||||||||||
| Changes in Inventories | ||||||||||
| Changes in Accounts Payable | ||||||||||
| Capital Expenditure | ||||||||||
| UFCF | -15,327.1 | 21,900.6 | 1,414.3 | 591.2 | 7,873.6 | -9,493.0 | 3,933.8 | 4,771.3 | 5,787.1 | 7,019.1 |
| WACC, % | 5.82 | 6.01 | 6.01 | 5.88 | 5.92 | 5.93 | 5.93 | 5.93 | 5.93 | 5.93 |
| PV UFCF | ||||||||||
| SUM PV UFCF | 8,417.5 | |||||||||
| Long Term Growth Rate, % | 2.00 | |||||||||
| Free cash flow (T + 1) | 7,160 | |||||||||
| Terminal Value | 182,248 | |||||||||
| Present Terminal Value | 136,647 | |||||||||
| Enterprise Value | 145,064 | |||||||||
| Net Debt | -4,825 | |||||||||
| Equity Value | 149,889 | |||||||||
| Diluted Shares Outstanding, MM | 941 | |||||||||
| Equity Value Per Share | 159.28 |
Benefits You Will Gain
- Pre-Populated Financial Model: Utilize Ircon International Limited's actual data for accurate DCF valuation.
- Comprehensive Forecasting Control: Modify revenue growth, profit margins, WACC, and other critical factors.
- Real-Time Calculations: Automatic updates allow you to view results instantly as you adjust inputs.
- Investor-Ready Framework: A polished Excel template crafted for high-quality valuation.
- Flexible and Reusable: Designed for adaptability, enabling repeated use for in-depth forecasts.
Key Features
- Customizable Forecast Inputs: Adjust essential metrics such as revenue growth, EBITDA %, and capital expenditures to fit your analysis.
- Instant DCF Valuation: Quickly generates intrinsic value, NPV, and other financial outputs with ease.
- High-Level Accuracy: Incorporates Ircon International Limited's real-world financial data for accurate valuation results.
- Simplified Scenario Analysis: Effortlessly evaluate various assumptions and analyze their effects on outcomes.
- Efficiency Booster: Save time by avoiding the complexity of building valuation models from the ground up.
How It Operates
- 1. Access the Template: Download and open the Excel sheet containing Ircon International Limited’s (IRCONNS) preloaded data.
- 2. Modify Assumptions: Adjust essential inputs such as growth rates, WACC, and capital expenditures.
- 3. See Immediate Results: The DCF model automatically calculates intrinsic value and NPV for you.
- 4. Experiment with Scenarios: Evaluate various forecasts to explore different valuation results.
- 5. Present with Assurance: Share expert valuation insights to back your decisions confidently.
Why Choose the IRCON International Limited (IRCONNS) Calculator?
- Time-Saving: Eliminate the hassle of building a DCF model from scratch – it's ready for immediate use.
- Enhanced Accuracy: Dependable financial data and formulas minimize valuation errors.
- Fully Customizable: Adjust the model to align with your specific assumptions and forecasts.
- User-Friendly: Intuitive charts and outputs make it easy to understand the results.
- Endorsed by Professionals: Crafted for experts who prioritize precision and functionality.
Who Can Benefit from Ircon International Limited (IRCONNS)?
- Investors: Enhance your investment strategies with our comprehensive valuation tool.
- Financial Analysts: Streamline your analysis with a customizable DCF model that's ready to use.
- Consultants: Effortlessly modify the template for impactful client presentations and reports.
- Finance Enthusiasts: Expand your knowledge of valuation methods through practical, real-world examples.
- Educators and Students: Utilize this tool as a valuable resource for finance education and coursework.
What the Template Contains
- Pre-Filled DCF Model: Ircon International Limited's (IRCONNS) financial data preloaded for immediate use.
- WACC Calculator: Comprehensive calculations for Weighted Average Cost of Capital.
- Financial Ratios: Assess Ircon International Limited’s profitability, leverage, and efficiency.
- Editable Inputs: Modify assumptions such as growth, margins, and CAPEX to suit your specific scenarios.
- Financial Statements: Annual and quarterly reports to facilitate thorough analysis.
- Interactive Dashboard: Effortlessly visualize key valuation metrics and outcomes.
Disclaimer
All information, articles, and product details provided on this website are for general informational and educational purposes only. We do not claim any ownership over, nor do we intend to infringe upon, any trademarks, copyrights, logos, brand names, or other intellectual property mentioned or depicted on this site. Such intellectual property remains the property of its respective owners, and any references here are made solely for identification or informational purposes, without implying any affiliation, endorsement, or partnership.
We make no representations or warranties, express or implied, regarding the accuracy, completeness, or suitability of any content or products presented. Nothing on this website should be construed as legal, tax, investment, financial, medical, or other professional advice. In addition, no part of this site—including articles or product references—constitutes a solicitation, recommendation, endorsement, advertisement, or offer to buy or sell any securities, franchises, or other financial instruments, particularly in jurisdictions where such activity would be unlawful.
All content is of a general nature and may not address the specific circumstances of any individual or entity. It is not a substitute for professional advice or services. Any actions you take based on the information provided here are strictly at your own risk. You accept full responsibility for any decisions or outcomes arising from your use of this website and agree to release us from any liability in connection with your use of, or reliance upon, the content or products found herein.