
|
IRIRIN MONTAIN INCORPORADA (IRM) Avaliação DCF |
Totalmente Editável: Adapte-Se Às Suas Necessidades No Excel Ou Planilhas
Design Profissional: Modelos Confiáveis E Padrão Da Indústria
Pré-Construídos Para Uso Rápido E Eficiente
Compatível com MAC/PC, totalmente desbloqueado
Não É Necessária Experiência; Fácil De Seguir
Iron Mountain Incorporated (IRM) Bundle
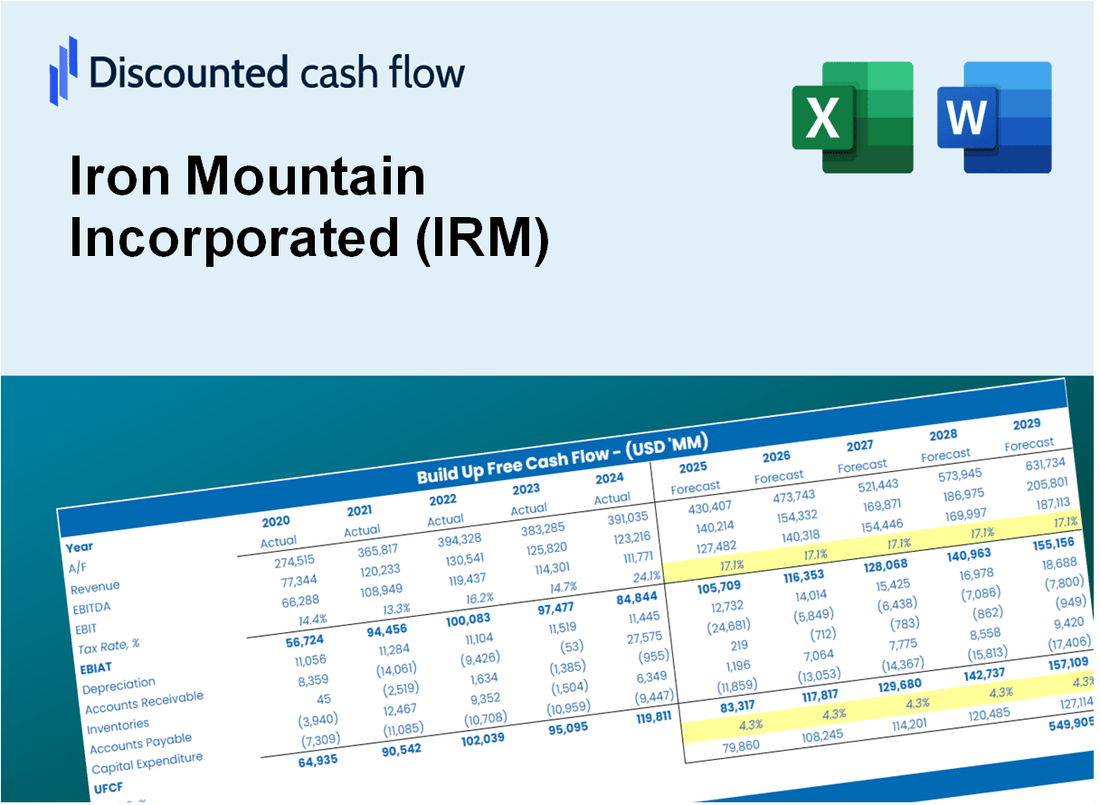
Atualize sua análise e melhore a precisão com a nossa calculadora DCF (IRM)! Utilizando dados reais da montanha de ferro e suposições personalizáveis, essa ferramenta capacita você a prever, analisar e avaliar a Iron Mountain Incorporated como um investidor profissional experiente.
Discounted Cash Flow (DCF) - (USD MM)
| Year | AY1 2020 |
AY2 2021 |
AY3 2022 |
AY4 2023 |
AY5 2024 |
FY1 2025 |
FY2 2026 |
FY3 2027 |
FY4 2028 |
FY5 2029 |
|---|---|---|---|---|---|---|---|---|---|---|
| Revenue | 4,147.3 | 4,491.5 | 5,103.6 | 5,480.3 | 6,149.9 | 6,788.4 | 7,493.1 | 8,271.1 | 9,129.8 | 10,077.6 |
| Revenue Growth, % | 0 | 8.3 | 13.63 | 7.38 | 12.22 | 10.38 | 10.38 | 10.38 | 10.38 | 10.38 |
| EBITDA | 1,469.0 | 1,751.3 | 1,873.6 | 1,618.6 | 1,907.3 | 2,330.7 | 2,572.7 | 2,839.8 | 3,134.6 | 3,460.1 |
| EBITDA, % | 35.42 | 38.99 | 36.71 | 29.54 | 31.01 | 34.33 | 34.33 | 34.33 | 34.33 | 34.33 |
| Depreciation | 669.4 | 697.0 | 745.6 | 793.0 | 926.5 | 1,029.2 | 1,136.0 | 1,254.0 | 1,384.2 | 1,527.9 |
| Depreciation, % | 16.14 | 15.52 | 14.61 | 14.47 | 15.07 | 15.16 | 15.16 | 15.16 | 15.16 | 15.16 |
| EBIT | 799.6 | 1,054.3 | 1,127.9 | 825.6 | 980.8 | 1,301.6 | 1,436.7 | 1,585.8 | 1,750.5 | 1,932.2 |
| EBIT, % | 19.28 | 23.47 | 22.1 | 15.07 | 15.95 | 19.17 | 19.17 | 19.17 | 19.17 | 19.17 |
| Total Cash | 205.1 | 255.8 | 141.8 | 222.8 | 155.7 | 271.8 | 300.0 | 331.1 | 365.5 | 403.4 |
| Total Cash, percent | .0 | .0 | .0 | .0 | .0 | .0 | .0 | .0 | .0 | .0 |
| Account Receivables | 859.3 | 961.4 | 1,174.9 | 1,259.8 | 1,291.4 | 1,481.7 | 1,635.5 | 1,805.3 | 1,992.7 | 2,199.6 |
| Account Receivables, % | 20.72 | 21.41 | 23.02 | 22.99 | 21 | 21.83 | 21.83 | 21.83 | 21.83 | 21.83 |
| Inventories | .0 | .0 | .0 | .0 | .0 | .0 | .0 | .0 | .0 | .0 |
| Inventories, % | 0 | 0 | 0 | 0 | 0 | 0 | 0 | 0 | 0 | 0 |
| Accounts Payable | 359.9 | 369.1 | 469.2 | 539.6 | 678.7 | 637.7 | 703.9 | 777.0 | 857.7 | 946.7 |
| Accounts Payable, % | 8.68 | 8.22 | 9.19 | 9.85 | 11.04 | 9.39 | 9.39 | 9.39 | 9.39 | 9.39 |
| Capital Expenditure | -453.3 | -624.4 | -883.6 | -1,345.1 | -1,854.0 | -1,314.7 | -1,451.2 | -1,601.8 | -1,768.1 | -1,951.7 |
| Capital Expenditure, % | -10.93 | -13.9 | -17.31 | -24.54 | -30.15 | -19.37 | -19.37 | -19.37 | -19.37 | -19.37 |
| Tax Rate, % | 26.33 | 26.33 | 26.33 | 26.33 | 26.33 | 26.33 | 26.33 | 26.33 | 26.33 | 26.33 |
| EBITAT | 735.2 | 754.6 | 994.6 | 669.5 | 722.6 | 1,058.1 | 1,167.9 | 1,289.2 | 1,423.0 | 1,570.7 |
| Depreciation | ||||||||||
| Changes in Account Receivables | ||||||||||
| Changes in Inventories | ||||||||||
| Changes in Accounts Payable | ||||||||||
| Capital Expenditure | ||||||||||
| UFCF | 451.9 | 734.4 | 743.2 | 102.9 | -97.3 | 541.3 | 765.1 | 844.6 | 932.3 | 1,029.1 |
| WACC, % | 7.22 | 6.87 | 7.15 | 7.03 | 6.91 | 7.04 | 7.04 | 7.04 | 7.04 | 7.04 |
| PV UFCF | ||||||||||
| SUM PV UFCF | 3,304.8 | |||||||||
| Long Term Growth Rate, % | 4.00 | |||||||||
| Free cash flow (T + 1) | 1,070 | |||||||||
| Terminal Value | 35,229 | |||||||||
| Present Terminal Value | 25,073 | |||||||||
| Enterprise Value | 28,378 | |||||||||
| Net Debt | 16,214 | |||||||||
| Equity Value | 12,164 | |||||||||
| Diluted Shares Outstanding, MM | 296 | |||||||||
| Equity Value Per Share | 41.06 |
What You Will Get
- Editable Forecast Inputs: Effortlessly modify assumptions (growth %, margins, WACC) to explore various scenarios.
- Real-World Data: Iron Mountain Incorporated’s (IRM) financial data pre-loaded to facilitate your analysis.
- Automatic DCF Outputs: The template computes Net Present Value (NPV) and intrinsic value automatically.
- Customizable and Professional: A sleek Excel model that adjusts to your specific valuation requirements.
- Built for Analysts and Investors: Perfect for evaluating projections, confirming strategies, and enhancing efficiency.
Key Features
- Pre-Loaded Data: Iron Mountain's historical financial statements and pre-filled forecasts.
- Fully Adjustable Inputs: Modify WACC, tax rates, revenue growth, and EBITDA margins.
- Instant Results: View Iron Mountain's intrinsic value recalculating in real time.
- Clear Visual Outputs: Dashboard charts showcase valuation results and key metrics.
- Built for Accuracy: A professional tool tailored for analysts, investors, and finance experts.
How It Works
- 1. Access the Template: Download and open the Excel file containing Iron Mountain Incorporated’s (IRM) preloaded data.
- 2. Adjust Key Inputs: Modify essential parameters such as growth rates, WACC, and capital expenditures.
- 3. Analyze Results Immediately: The DCF model automatically computes intrinsic value and NPV based on your inputs.
- 4. Explore Different Scenarios: Evaluate various forecasts to understand different valuation possibilities.
- 5. Present with Assurance: Deliver professional valuation analyses to back your strategic decisions.
Why Choose This Calculator for Iron Mountain Incorporated (IRM)?
- Accurate Data: Utilize real Iron Mountain financials for dependable valuation outcomes.
- Customizable: Tailor essential parameters such as growth rates, WACC, and tax rates to align with your forecasts.
- Time-Saving: Pre-configured calculations save you from starting from the ground up.
- Professional-Grade Tool: Crafted for investors, analysts, and consultants in the industry.
- User-Friendly: An intuitive design and step-by-step guidance make it accessible for all users.
Who Should Use Iron Mountain Incorporated (IRM)?
- Investors: Gain insights and make informed decisions with a trusted data management partner.
- Financial Analysts: Streamline your analysis with comprehensive reports and resources available from Iron Mountain.
- Consultants: Easily customize solutions to meet your clients' data storage and management needs.
- Business Leaders: Enhance operational efficiency by leveraging Iron Mountain's innovative storage solutions.
- Educators and Students: Explore case studies and resources to enrich your understanding of data management practices.
What the Template Contains
- Operating and Balance Sheet Data: Pre-filled Iron Mountain Incorporated (IRM) historical data and forecasts, including revenue, EBITDA, EBIT, and capital expenditures.
- WACC Calculation: A dedicated sheet for Weighted Average Cost of Capital (WACC), featuring parameters such as Beta, risk-free rate, and share price.
- DCF Valuation (Unlevered and Levered): Editable Discounted Cash Flow models that illustrate intrinsic value with comprehensive calculations.
- Financial Statements: Pre-loaded financial statements (annual and quarterly) to facilitate thorough analysis.
- Key Ratios: Includes profitability, leverage, and efficiency ratios for Iron Mountain Incorporated (IRM).
- Dashboard and Charts: Visual summary of valuation outputs and assumptions for easy result analysis.
Disclaimer
All information, articles, and product details provided on this website are for general informational and educational purposes only. We do not claim any ownership over, nor do we intend to infringe upon, any trademarks, copyrights, logos, brand names, or other intellectual property mentioned or depicted on this site. Such intellectual property remains the property of its respective owners, and any references here are made solely for identification or informational purposes, without implying any affiliation, endorsement, or partnership.
We make no representations or warranties, express or implied, regarding the accuracy, completeness, or suitability of any content or products presented. Nothing on this website should be construed as legal, tax, investment, financial, medical, or other professional advice. In addition, no part of this site—including articles or product references—constitutes a solicitation, recommendation, endorsement, advertisement, or offer to buy or sell any securities, franchises, or other financial instruments, particularly in jurisdictions where such activity would be unlawful.
All content is of a general nature and may not address the specific circumstances of any individual or entity. It is not a substitute for professional advice or services. Any actions you take based on the information provided here are strictly at your own risk. You accept full responsibility for any decisions or outcomes arising from your use of this website and agree to release us from any liability in connection with your use of, or reliance upon, the content or products found herein.