
|
Ithaca Energy plc (iTh.l) Avaliação DCF |
Totalmente Editável: Adapte-Se Às Suas Necessidades No Excel Ou Planilhas
Design Profissional: Modelos Confiáveis E Padrão Da Indústria
Pré-Construídos Para Uso Rápido E Eficiente
Compatível com MAC/PC, totalmente desbloqueado
Não É Necessária Experiência; Fácil De Seguir
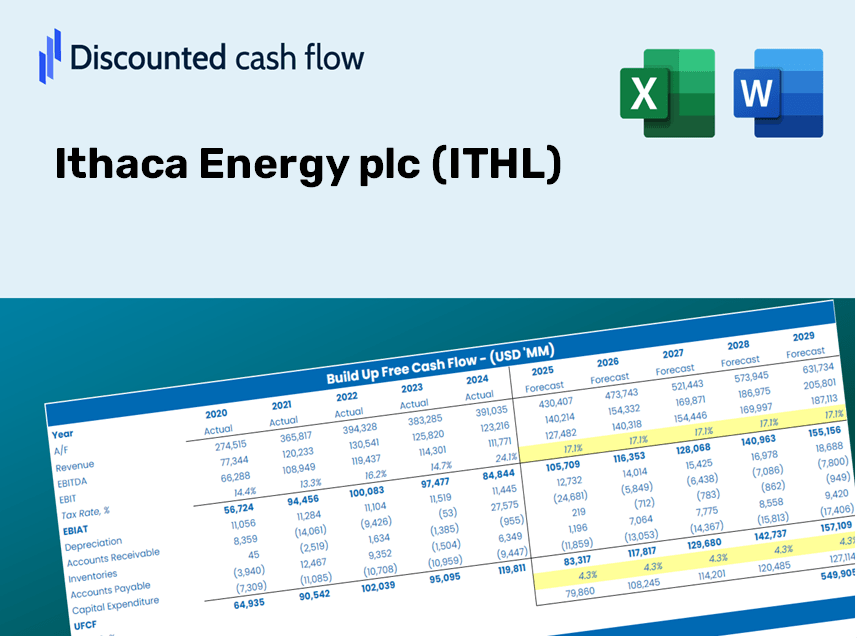
Ithaca Energy plc (ITH.L) Bundle
Seja você um investidor ou analista, esta calculadora DCF (ITHL) é o seu recurso preferido para uma avaliação precisa. Carregado com dados reais do Ithaca Energy plc, você pode ajustar as previsões e observar instantaneamente os efeitos.
Discounted Cash Flow (DCF) - (USD MM)
| Year | AY1 2020 |
AY2 2021 |
AY3 2022 |
AY4 2023 |
AY5 2024 |
FY1 2025 |
FY2 2026 |
FY3 2027 |
FY4 2028 |
FY5 2029 |
|---|---|---|---|---|---|---|---|---|---|---|
| Revenue | 842.1 | 1,085.9 | 1,975.6 | 1,763.7 | 1,506.8 | 1,829.2 | 2,220.6 | 2,695.8 | 3,272.7 | 3,973.0 |
| Revenue Growth, % | 0 | 28.95 | 81.94 | -10.72 | -14.57 | 21.4 | 21.4 | 21.4 | 21.4 | 21.4 |
| EBITDA | 470.0 | 698.0 | 1,361.8 | 875.4 | 789.9 | 1,064.9 | 1,292.8 | 1,569.4 | 1,905.3 | 2,313.0 |
| EBITDA, % | 55.81 | 64.28 | 68.93 | 49.63 | 52.43 | 58.22 | 58.22 | 58.22 | 58.22 | 58.22 |
| Depreciation | 283.5 | 346.6 | 504.0 | 562.8 | 456.3 | 560.8 | 680.8 | 826.5 | 1,003.4 | 1,218.1 |
| Depreciation, % | 33.66 | 31.92 | 25.51 | 31.91 | 30.29 | 30.66 | 30.66 | 30.66 | 30.66 | 30.66 |
| EBIT | 186.5 | 351.4 | 857.8 | 312.5 | 333.6 | 504.1 | 612.0 | 742.9 | 901.9 | 1,094.9 |
| EBIT, % | 22.15 | 32.36 | 43.42 | 17.72 | 22.14 | 27.56 | 27.56 | 27.56 | 27.56 | 27.56 |
| Total Cash | .9 | 34.1 | 193.0 | 119.0 | 135.4 | 105.2 | 127.7 | 155.0 | 188.2 | 228.5 |
| Total Cash, percent | .0 | .0 | .0 | .0 | .0 | .0 | .0 | .0 | .0 | .0 |
| Account Receivables | 70.5 | 14.4 | 423.0 | 15.2 | 335.1 | 198.3 | 240.8 | 292.3 | 354.9 | 430.8 |
| Account Receivables, % | 8.38 | 1.32 | 21.41 | 0.86076 | 22.24 | 10.84 | 10.84 | 10.84 | 10.84 | 10.84 |
| Inventories | 81.1 | 135.0 | 134.5 | 114.4 | 215.8 | 181.8 | 220.7 | 267.9 | 325.2 | 394.8 |
| Inventories, % | 9.63 | 12.44 | 6.81 | 6.49 | 14.32 | 9.94 | 9.94 | 9.94 | 9.94 | 9.94 |
| Accounts Payable | 13.5 | 10.6 | 11.3 | 26.3 | 16.7 | 21.0 | 25.5 | 31.0 | 37.6 | 45.7 |
| Accounts Payable, % | 1.6 | 0.9733 | 0.57407 | 1.49 | 1.11 | 1.15 | 1.15 | 1.15 | 1.15 | 1.15 |
| Capital Expenditure | -108.0 | -205.0 | -289.4 | -364.0 | -352.8 | -330.8 | -401.5 | -487.5 | -591.8 | -718.4 |
| Capital Expenditure, % | -12.83 | -18.88 | -14.65 | -20.64 | -23.42 | -18.08 | -18.08 | -18.08 | -18.08 | -18.08 |
| Tax Rate, % | 54.19 | 54.19 | 54.19 | 54.19 | 54.19 | 54.19 | 54.19 | 54.19 | 54.19 | 54.19 |
| EBITAT | 141.7 | 285.8 | 394.9 | 223.1 | 152.8 | 323.2 | 392.3 | 476.3 | 578.2 | 702.0 |
| Depreciation | ||||||||||
| Changes in Account Receivables | ||||||||||
| Changes in Inventories | ||||||||||
| Changes in Accounts Payable | ||||||||||
| Capital Expenditure | ||||||||||
| UFCF | 179.0 | 426.7 | 202.3 | 864.7 | -174.6 | 728.4 | 594.8 | 722.1 | 876.6 | 1,064.2 |
| WACC, % | 6.9 | 7.03 | 6.2 | 6.8 | 6.19 | 6.62 | 6.62 | 6.62 | 6.62 | 6.62 |
| PV UFCF | ||||||||||
| SUM PV UFCF | 3,252.4 | |||||||||
| Long Term Growth Rate, % | 0.50 | |||||||||
| Free cash flow (T + 1) | 1,069 | |||||||||
| Terminal Value | 17,464 | |||||||||
| Present Terminal Value | 12,673 | |||||||||
| Enterprise Value | 15,925 | |||||||||
| Net Debt | 684 | |||||||||
| Equity Value | 15,241 | |||||||||
| Diluted Shares Outstanding, MM | 1,175 | |||||||||
| Equity Value Per Share | 1,297.30 |
What You Will Receive
- Authentic ITHL Financial Data: Pre-filled with Ithaca Energy's historical and projected figures for thorough analysis.
- Fully Customizable Template: Easily adjust key variables such as revenue growth, WACC, and EBITDA percentage.
- Real-Time Calculations: Observe Ithaca Energy's intrinsic value update immediately as you make adjustments.
- Professional Valuation Tool: Tailored for investors, analysts, and consultants who require precise DCF outputs.
- User-Friendly Interface: Intuitive layout and straightforward instructions suitable for all skill levels.
Key Features
- 🔍 Real-Life ITHL Financials: Pre-filled historical and projected data for Ithaca Energy plc.
- ✏️ Fully Customizable Inputs: Adjust all critical parameters (yellow cells) such as WACC, growth %, and tax rates.
- 📊 Professional DCF Valuation: Built-in formulas compute Ithaca Energy's intrinsic value using the Discounted Cash Flow method.
- ⚡ Instant Results: Visualize Ithaca Energy's valuation immediately after making adjustments.
- Scenario Analysis: Evaluate and compare outcomes for various financial assumptions side-by-side.
How It Functions
- 1. Access the Template: Download and open the Excel file containing Ithaca Energy plc’s (ITHL) preloaded data.
- 2. Modify Assumptions: Adjust crucial inputs such as growth rates, WACC, and capital expenditures as needed.
- 3. Instant Results: The DCF model automatically calculates intrinsic value and NPV in real-time.
- 4. Explore Scenarios: Analyze various forecasts to evaluate different valuation possibilities.
- 5. Present with Assurance: Deliver professional valuation insights to back your decision-making process.
Why Choose This Calculator for Ithaca Energy (ITHL)?
- User-Friendly Interface: Tailored for both novice users and seasoned professionals.
- Customizable Inputs: Easily adjust parameters to suit your financial analysis.
- Real-Time Valuation: Observe immediate updates to Ithaca Energy’s valuation as you change inputs.
- Pre-Configured Data: Comes with Ithaca Energy’s actual financial figures for swift evaluations.
- Relied Upon by Experts: Trusted by investors and analysts for making well-informed investment choices.
Who Can Benefit from This Product?
- Investors: Evaluate the valuation of Ithaca Energy plc (ITHL) before making buy or sell decisions.
- CFOs and Financial Analysts: Optimize valuation procedures and assess financial forecasts.
- Startup Founders: Understand how established companies, such as Ithaca Energy plc (ITHL), are valued in the market.
- Consultants: Create detailed valuation reports for your clients centered on Ithaca Energy plc (ITHL).
- Students and Educators: Utilize real-time data to practice and teach valuation methods related to Ithaca Energy plc (ITHL).
Contents of the Template
- Pre-Filled Data: Features Ithaca Energy plc's (ITHL) historical financial information and projections.
- Discounted Cash Flow Model: An editable DCF valuation model with automatic calculations.
- Weighted Average Cost of Capital (WACC): A dedicated worksheet for computing WACC based on user-defined inputs.
- Key Financial Ratios: Assess Ithaca Energy plc's (ITHL) profitability, operational efficiency, and leverage.
- Customizable Inputs: Easily adjust revenue growth, profit margins, and tax rates.
- Clear Dashboard: Visual summaries in the form of charts and tables highlighting key valuation outcomes.
Disclaimer
All information, articles, and product details provided on this website are for general informational and educational purposes only. We do not claim any ownership over, nor do we intend to infringe upon, any trademarks, copyrights, logos, brand names, or other intellectual property mentioned or depicted on this site. Such intellectual property remains the property of its respective owners, and any references here are made solely for identification or informational purposes, without implying any affiliation, endorsement, or partnership.
We make no representations or warranties, express or implied, regarding the accuracy, completeness, or suitability of any content or products presented. Nothing on this website should be construed as legal, tax, investment, financial, medical, or other professional advice. In addition, no part of this site—including articles or product references—constitutes a solicitation, recommendation, endorsement, advertisement, or offer to buy or sell any securities, franchises, or other financial instruments, particularly in jurisdictions where such activity would be unlawful.
All content is of a general nature and may not address the specific circumstances of any individual or entity. It is not a substitute for professional advice or services. Any actions you take based on the information provided here are strictly at your own risk. You accept full responsibility for any decisions or outcomes arising from your use of this website and agree to release us from any liability in connection with your use of, or reliance upon, the content or products found herein.