
|
ITT Inc. (ITT) DCF Avaliação |
Totalmente Editável: Adapte-Se Às Suas Necessidades No Excel Ou Planilhas
Design Profissional: Modelos Confiáveis E Padrão Da Indústria
Pré-Construídos Para Uso Rápido E Eficiente
Compatível com MAC/PC, totalmente desbloqueado
Não É Necessária Experiência; Fácil De Seguir
ITT Inc. (ITT) Bundle
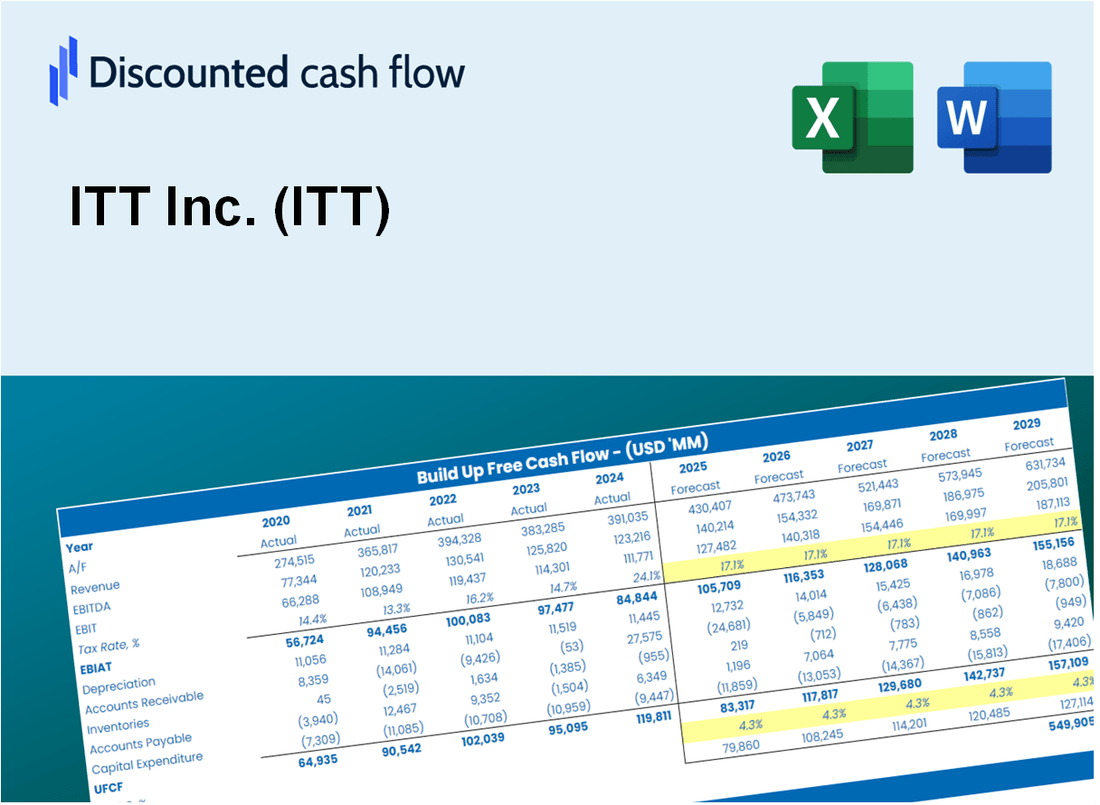
Ganhe domínio sobre sua análise de avaliação ITT Inc. (ITT) usando nossa sofisticada calculadora DCF! Este modelo do Excel é pré -carregado com dados ITT reais, permitindo ajustar as previsões e suposições para determinar o valor intrínseco da ITT Inc. (ITT) com precisão.
Discounted Cash Flow (DCF) - (USD MM)
| Year | AY1 2020 |
AY2 2021 |
AY3 2022 |
AY4 2023 |
AY5 2024 |
FY1 2025 |
FY2 2026 |
FY3 2027 |
FY4 2028 |
FY5 2029 |
|---|---|---|---|---|---|---|---|---|---|---|
| Revenue | 2,477.8 | 2,765.0 | 2,987.7 | 3,283.0 | 3,630.7 | 3,994.9 | 4,395.5 | 4,836.4 | 5,321.5 | 5,855.3 |
| Revenue Growth, % | 0 | 11.59 | 8.05 | 9.88 | 10.59 | 10.03 | 10.03 | 10.03 | 10.03 | 10.03 |
| EBITDA | 433.5 | 521.6 | 580.1 | 647.9 | 821.5 | 784.1 | 862.7 | 949.3 | 1,044.5 | 1,149.2 |
| EBITDA, % | 17.5 | 18.86 | 19.42 | 19.73 | 22.63 | 19.63 | 19.63 | 19.63 | 19.63 | 19.63 |
| Depreciation | 112.2 | 113.1 | 107.4 | 109.2 | 137.3 | 154.4 | 169.9 | 186.9 | 205.6 | 226.3 |
| Depreciation, % | 4.53 | 4.09 | 3.59 | 3.33 | 3.78 | 3.86 | 3.86 | 3.86 | 3.86 | 3.86 |
| EBIT | 321.3 | 408.5 | 472.7 | 538.7 | 684.2 | 629.7 | 692.9 | 762.4 | 838.8 | 923.0 |
| EBIT, % | 12.97 | 14.77 | 15.82 | 16.41 | 18.84 | 15.76 | 15.76 | 15.76 | 15.76 | 15.76 |
| Total Cash | 859.8 | 647.5 | 561.2 | 489.2 | 439.3 | 830.1 | 913.4 | 1,005.0 | 1,105.8 | 1,216.7 |
| Total Cash, percent | .0 | .0 | .0 | .0 | .0 | .0 | .0 | .0 | .0 | .0 |
| Account Receivables | 526.6 | 575.7 | 655.1 | 701.0 | 737.4 | 844.2 | 928.9 | 1,022.1 | 1,124.6 | 1,237.4 |
| Account Receivables, % | 21.25 | 20.82 | 21.93 | 21.35 | 20.31 | 21.13 | 21.13 | 21.13 | 21.13 | 21.13 |
| Inventories | 360.5 | 430.9 | 533.9 | 575.4 | 591.2 | 653.7 | 719.2 | 791.4 | 870.7 | 958.1 |
| Inventories, % | 14.55 | 15.58 | 17.87 | 17.53 | 16.28 | 16.36 | 16.36 | 16.36 | 16.36 | 16.36 |
| Accounts Payable | 306.8 | 373.4 | 401.1 | 437.0 | 458.4 | 521.3 | 573.6 | 631.1 | 694.4 | 764.1 |
| Accounts Payable, % | 12.38 | 13.5 | 13.43 | 13.31 | 12.63 | 13.05 | 13.05 | 13.05 | 13.05 | 13.05 |
| Capital Expenditure | -63.7 | -88.4 | -103.9 | -107.6 | -123.9 | -127.3 | -140.1 | -154.1 | -169.6 | -186.6 |
| Capital Expenditure, % | -2.57 | -3.2 | -3.48 | -3.28 | -3.41 | -3.19 | -3.19 | -3.19 | -3.19 | -3.19 |
| Tax Rate, % | 19.97 | 19.97 | 19.97 | 19.97 | 19.97 | 19.97 | 19.97 | 19.97 | 19.97 | 19.97 |
| EBITAT | 273.4 | 253.8 | 375.7 | 425.7 | 547.6 | 485.8 | 534.6 | 588.2 | 647.2 | 712.1 |
| Depreciation | ||||||||||
| Changes in Account Receivables | ||||||||||
| Changes in Inventories | ||||||||||
| Changes in Accounts Payable | ||||||||||
| Capital Expenditure | ||||||||||
| UFCF | -258.4 | 225.6 | 224.5 | 375.8 | 530.2 | 406.5 | 466.4 | 513.1 | 564.6 | 621.2 |
| WACC, % | 9.96 | 9.9 | 9.94 | 9.94 | 9.95 | 9.94 | 9.94 | 9.94 | 9.94 | 9.94 |
| PV UFCF | ||||||||||
| SUM PV UFCF | 1,915.1 | |||||||||
| Long Term Growth Rate, % | 3.00 | |||||||||
| Free cash flow (T + 1) | 640 | |||||||||
| Terminal Value | 9,222 | |||||||||
| Present Terminal Value | 5,742 | |||||||||
| Enterprise Value | 7,657 | |||||||||
| Net Debt | 317 | |||||||||
| Equity Value | 7,340 | |||||||||
| Diluted Shares Outstanding, MM | 82 | |||||||||
| Equity Value Per Share | 89.18 |
What You Will Receive
- Customizable Excel Template: A fully adaptable Excel-based DCF Calculator featuring pre-filled real ITT financials.
- Actual Data Insights: Access to historical data and forward-looking estimates (highlighted in the yellow cells).
- Forecast Customization: Modify forecast parameters such as revenue growth, EBITDA %, and WACC.
- Instant Calculations: Quickly observe how your inputs influence ITT’s valuation.
- Professional Resource: Designed for investors, CFOs, consultants, and financial analysts.
- Intuitive Layout: Organized for clarity and user-friendliness, complete with step-by-step guidance.
Key Features
- Comprehensive DCF Calculator: Features both unlevered and levered DCF valuation models tailored for ITT Inc. (ITT).
- WACC Calculator: Ready-to-use Weighted Average Cost of Capital sheet with adjustable inputs specific to ITT Inc. (ITT).
- Customizable Forecast Assumptions: Adjust growth rates, capital expenditures, and discount rates as per ITT Inc. (ITT) needs.
- Integrated Financial Ratios: Evaluate profitability, leverage, and efficiency ratios relevant to ITT Inc. (ITT).
- Interactive Dashboard and Charts: Visual representations that summarize essential valuation metrics for straightforward analysis of ITT Inc. (ITT).
How It Functions
- Download the Template: Gain immediate access to the Excel-based ITT DCF Calculator.
- Input Your Assumptions: Modify the yellow-highlighted cells for growth rates, WACC, margins, and additional variables.
- Instant Calculations: The model automatically refreshes ITT’s intrinsic value.
- Test Scenarios: Experiment with various assumptions to assess potential valuation shifts.
- Analyze and Decide: Leverage the outcomes to inform your investment or financial analysis.
Why Choose This Calculator for ITT Inc. (ITT)?
- Designed for Experts: A sophisticated tool tailored for analysts, CFOs, and industry consultants.
- Accurate Financial Data: ITT's historical and projected financials are preloaded for precision.
- Versatile Scenario Analysis: Effortlessly simulate various forecasts and assumptions.
- Comprehensive Outputs: Automatically computes intrinsic value, NPV, and essential metrics.
- User-Friendly: Step-by-step guidance makes the process straightforward.
Who Should Use This Product?
- Finance Students: Master valuation techniques and apply them using real-world data related to ITT Inc. (ITT).
- Academics: Integrate professional valuation models into your coursework or research focused on ITT Inc. (ITT).
- Investors: Challenge your own assumptions and evaluate valuation outcomes for ITT Inc. (ITT) stock.
- Analysts: Enhance your efficiency with a ready-made, customizable DCF model tailored for ITT Inc. (ITT).
- Small Business Owners: Discover how large public companies like ITT Inc. (ITT) are analyzed and valued.
What the Template Contains
- Comprehensive DCF Model: Editable template featuring detailed valuation calculations specific to ITT Inc. (ITT).
- Real-World Data: ITT’s historical and projected financials preloaded for thorough analysis.
- Customizable Parameters: Modify WACC, growth rates, and tax assumptions to evaluate different scenarios.
- Financial Statements: Complete annual and quarterly breakdowns for enhanced insights.
- Key Ratios: Integrated analysis for profitability, efficiency, and leverage metrics.
- Dashboard with Visual Outputs: Visual representations such as charts and tables for clear, actionable insights.
Disclaimer
All information, articles, and product details provided on this website are for general informational and educational purposes only. We do not claim any ownership over, nor do we intend to infringe upon, any trademarks, copyrights, logos, brand names, or other intellectual property mentioned or depicted on this site. Such intellectual property remains the property of its respective owners, and any references here are made solely for identification or informational purposes, without implying any affiliation, endorsement, or partnership.
We make no representations or warranties, express or implied, regarding the accuracy, completeness, or suitability of any content or products presented. Nothing on this website should be construed as legal, tax, investment, financial, medical, or other professional advice. In addition, no part of this site—including articles or product references—constitutes a solicitation, recommendation, endorsement, advertisement, or offer to buy or sell any securities, franchises, or other financial instruments, particularly in jurisdictions where such activity would be unlawful.
All content is of a general nature and may not address the specific circumstances of any individual or entity. It is not a substitute for professional advice or services. Any actions you take based on the information provided here are strictly at your own risk. You accept full responsibility for any decisions or outcomes arising from your use of this website and agree to release us from any liability in connection with your use of, or reliance upon, the content or products found herein.