
|
IZEA Worldwide, Inc. (IZEA) Avaliação DCF |
Totalmente Editável: Adapte-Se Às Suas Necessidades No Excel Ou Planilhas
Design Profissional: Modelos Confiáveis E Padrão Da Indústria
Pré-Construídos Para Uso Rápido E Eficiente
Compatível com MAC/PC, totalmente desbloqueado
Não É Necessária Experiência; Fácil De Seguir
IZEA Worldwide, Inc. (IZEA) Bundle
Descubra o verdadeiro potencial da IZEA Worldwide, Inc. (IZEA) com nossa calculadora DCF avançada! Ajuste as suposições críticas, explore vários cenários e avalie como as mudanças influenciam a avaliação da IZEA - tudo o que você precisa está incluído em um modelo abrangente do Excel.
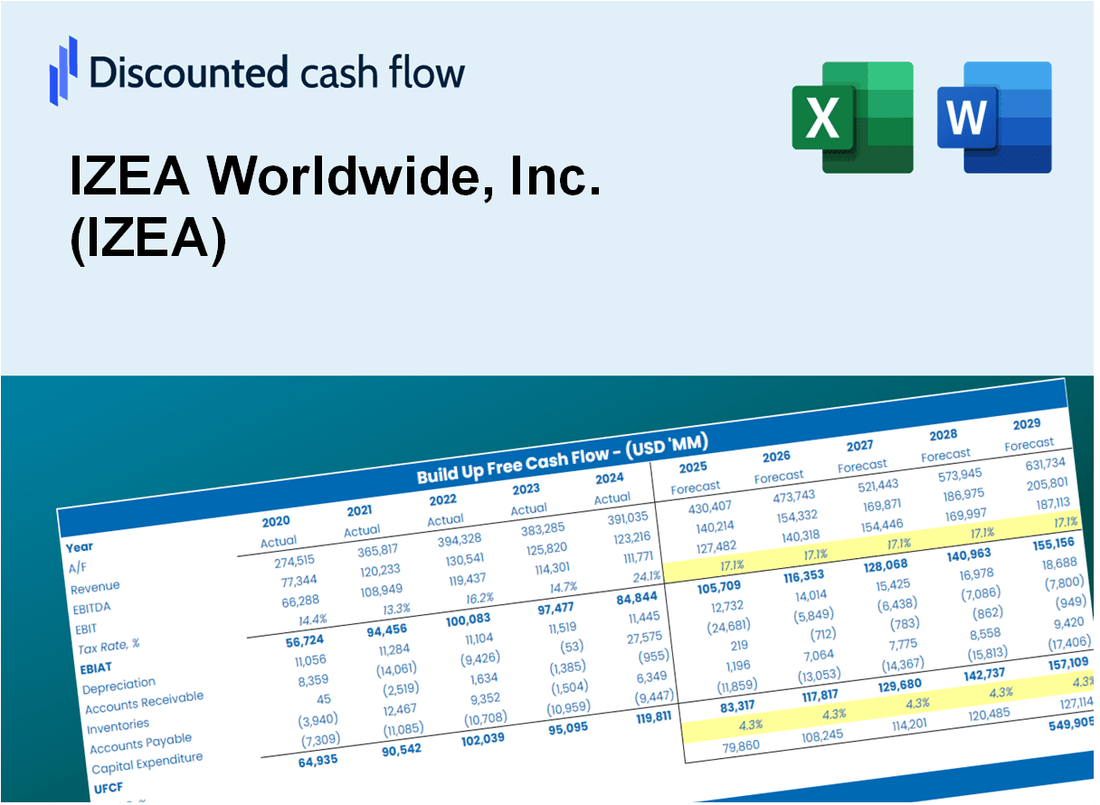
Discounted Cash Flow (DCF) - (USD MM)
| Year | AY1 2020 |
AY2 2021 |
AY3 2022 |
AY4 2023 |
AY5 2024 |
FY1 2025 |
FY2 2026 |
FY3 2027 |
FY4 2028 |
FY5 2029 |
|---|---|---|---|---|---|---|---|---|---|---|
| Revenue | 18.0 | 30.0 | 41.1 | 36.2 | 35.9 | 44.1 | 54.1 | 66.4 | 81.6 | 100.2 |
| Revenue Growth, % | 0 | 67.1 | 36.88 | -11.88 | -0.92114 | 22.8 | 22.8 | 22.8 | 22.8 | 22.8 |
| EBITDA | -8.8 | -2.0 | -3.6 | -6.6 | -18.1 | -11.7 | -14.4 | -17.7 | -21.7 | -26.7 |
| EBITDA, % | -48.94 | -6.75 | -8.86 | -18.32 | -50.39 | -26.65 | -26.65 | -26.65 | -26.65 | -26.65 |
| Depreciation | 1.7 | 1.1 | .8 | .7 | 1.2 | 1.8 | 2.2 | 2.7 | 3.3 | 4.0 |
| Depreciation, % | 9.2 | 3.63 | 2.02 | 1.97 | 3.23 | 4.01 | 4.01 | 4.01 | 4.01 | 4.01 |
| EBIT | -10.4 | -3.1 | -4.5 | -7.3 | -19.2 | -13.5 | -16.6 | -20.4 | -25.0 | -30.7 |
| EBIT, % | -58.14 | -10.38 | -10.87 | -20.29 | -53.62 | -30.66 | -30.66 | -30.66 | -30.66 | -30.66 |
| Total Cash | 33.0 | 75.4 | 40.7 | 54.6 | 51.1 | 44.0 | 54.0 | 66.3 | 81.4 | 100.0 |
| Total Cash, percent | .0 | .0 | .0 | .0 | .0 | .0 | .0 | .0 | .0 | .0 |
| Account Receivables | 5.2 | 7.6 | 5.7 | 5.0 | 7.8 | 9.1 | 11.2 | 13.8 | 16.9 | 20.8 |
| Account Receivables, % | 28.98 | 25.31 | 13.78 | 13.84 | 21.69 | 20.72 | 20.72 | 20.72 | 20.72 | 20.72 |
| Inventories | .0 | .0 | 3.9 | .0 | .0 | .8 | 1.0 | 1.3 | 1.6 | 1.9 |
| Inventories, % | 0 | 0 | 9.56 | 0 | 0 | 1.91 | 1.91 | 1.91 | 1.91 | 1.91 |
| Accounts Payable | 2.3 | 2.1 | 2.0 | 1.5 | 1.5 | 2.9 | 3.6 | 4.4 | 5.4 | 6.6 |
| Accounts Payable, % | 12.86 | 6.95 | 4.79 | 4.15 | 4.21 | 6.59 | 6.59 | 6.59 | 6.59 | 6.59 |
| Capital Expenditure | -.4 | -.3 | -1.6 | -1.0 | -.9 | -1.1 | -1.3 | -1.6 | -2.0 | -2.4 |
| Capital Expenditure, % | -2.13 | -0.93171 | -3.78 | -2.8 | -2.41 | -2.41 | -2.41 | -2.41 | -2.41 | -2.41 |
| Tax Rate, % | 2.05 | 2.05 | 2.05 | 2.05 | 2.05 | 2.05 | 2.05 | 2.05 | 2.05 | 2.05 |
| EBITAT | -10.4 | -3.1 | -4.5 | -7.3 | -18.8 | -13.5 | -16.5 | -20.3 | -24.9 | -30.6 |
| Depreciation | ||||||||||
| Changes in Account Receivables | ||||||||||
| Changes in Inventories | ||||||||||
| Changes in Accounts Payable | ||||||||||
| Capital Expenditure | ||||||||||
| UFCF | -12.1 | -4.9 | -7.3 | -3.5 | -21.3 | -13.5 | -17.3 | -21.2 | -26.0 | -32.0 |
| WACC, % | 8.87 | 8.87 | 8.87 | 8.87 | 8.87 | 8.87 | 8.87 | 8.87 | 8.87 | 8.87 |
| PV UFCF | ||||||||||
| SUM PV UFCF | -82.9 | |||||||||
| Long Term Growth Rate, % | 4.00 | |||||||||
| Free cash flow (T + 1) | -33 | |||||||||
| Terminal Value | -683 | |||||||||
| Present Terminal Value | -446 | |||||||||
| Enterprise Value | -529 | |||||||||
| Net Debt | -45 | |||||||||
| Equity Value | -485 | |||||||||
| Diluted Shares Outstanding, MM | 17 | |||||||||
| Equity Value Per Share | -28.40 |
What You Will Get
- Real IZEA Financial Data: Pre-filled with IZEA Worldwide, Inc.'s historical and projected data for precise analysis.
- Fully Editable Template: Modify key inputs like revenue growth, WACC, and EBITDA % with ease.
- Automatic Calculations: See IZEA's intrinsic value update instantly based on your changes.
- Professional Valuation Tool: Designed for investors, analysts, and consultants seeking accurate DCF results.
- User-Friendly Design: Simple structure and clear instructions for all experience levels.
Key Features
- Customizable Revenue Inputs: Adjust essential factors such as user growth, advertising revenue, and operational costs.
- Instant DCF Valuation: Automatically computes intrinsic value, NPV, and additional metrics in real-time.
- High-Precision Accuracy: Leverages IZEA's actual financial data for dependable valuation results.
- Effortless Scenario Analysis: Easily evaluate various assumptions and analyze their impacts side by side.
- Efficiency Booster: Remove the hassle of constructing intricate valuation models from the ground up.
How It Works
- Download the Template: Gain immediate access to the Excel-based IZEA DCF Calculator.
- Input Your Assumptions: Modify the yellow-highlighted cells for growth rates, WACC, margins, and additional parameters.
- Instant Calculations: The model automatically recalculates IZEA’s intrinsic value.
- Test Scenarios: Experiment with various assumptions to assess potential changes in valuation.
- Analyze and Decide: Utilize the results to inform your investment or financial analysis.
Why Choose IZEA Worldwide, Inc. (IZEA)?
- Streamlined Processes: Skip the hassle of manual calculations – our platform is ready to go.
- Enhanced Precision: Access to accurate data and analytics minimizes valuation mistakes.
- Completely Adaptable: Modify the tools to align with your specific strategies and forecasts.
- User-Friendly Interface: Intuitive dashboards and reports simplify data interpretation.
- Endorsed by Industry Leaders: Crafted for professionals who prioritize accuracy and functionality.
Who Should Use This Product?
- Individual Investors: Make informed decisions about buying or selling IZEA Worldwide, Inc. (IZEA) stock.
- Financial Analysts: Streamline valuation processes with ready-to-use financial models for IZEA Worldwide, Inc. (IZEA).
- Consultants: Deliver professional valuation insights on IZEA Worldwide, Inc. (IZEA) to clients quickly and accurately.
- Business Owners: Understand how companies like IZEA Worldwide, Inc. (IZEA) are valued to guide your own strategy.
- Finance Students: Learn valuation techniques using real-world data and scenarios related to IZEA Worldwide, Inc. (IZEA).
What the Template Contains
- Pre-Filled Data: Includes IZEA Worldwide, Inc.'s historical financials and forecasts.
- Discounted Cash Flow Model: Editable DCF valuation model with automatic calculations.
- Weighted Average Cost of Capital (WACC): A dedicated sheet for calculating WACC based on custom inputs.
- Key Financial Ratios: Analyze IZEA Worldwide, Inc.'s profitability, efficiency, and leverage.
- Customizable Inputs: Edit revenue growth, margins, and tax rates with ease.
- Clear Dashboard: Charts and tables summarizing key valuation results.
Disclaimer
All information, articles, and product details provided on this website are for general informational and educational purposes only. We do not claim any ownership over, nor do we intend to infringe upon, any trademarks, copyrights, logos, brand names, or other intellectual property mentioned or depicted on this site. Such intellectual property remains the property of its respective owners, and any references here are made solely for identification or informational purposes, without implying any affiliation, endorsement, or partnership.
We make no representations or warranties, express or implied, regarding the accuracy, completeness, or suitability of any content or products presented. Nothing on this website should be construed as legal, tax, investment, financial, medical, or other professional advice. In addition, no part of this site—including articles or product references—constitutes a solicitation, recommendation, endorsement, advertisement, or offer to buy or sell any securities, franchises, or other financial instruments, particularly in jurisdictions where such activity would be unlawful.
All content is of a general nature and may not address the specific circumstances of any individual or entity. It is not a substitute for professional advice or services. Any actions you take based on the information provided here are strictly at your own risk. You accept full responsibility for any decisions or outcomes arising from your use of this website and agree to release us from any liability in connection with your use of, or reliance upon, the content or products found herein.