
|
JDE Peet's N.V. (JDep.as) Avaliação DCF |
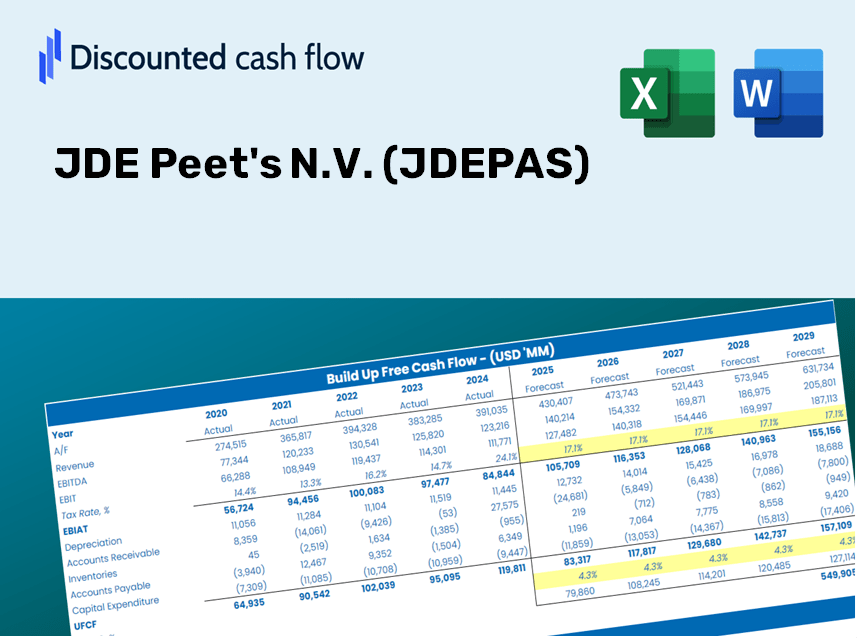
Totalmente Editável: Adapte-Se Às Suas Necessidades No Excel Ou Planilhas
Design Profissional: Modelos Confiáveis E Padrão Da Indústria
Pré-Construídos Para Uso Rápido E Eficiente
Compatível com MAC/PC, totalmente desbloqueado
Não É Necessária Experiência; Fácil De Seguir
JDE Peet's N.V. (JDEP.AS) Bundle
Procurando avaliar o valor intrínseco do N.V. da JDE Peet? Nossa calculadora JDEPAS DCF integra dados do mundo real com recursos abrangentes de personalização, permitindo refinar suas previsões e aprimorar suas estratégias de investimento.
Discounted Cash Flow (DCF) - (USD MM)
| Year | AY1 2020 |
AY2 2021 |
AY3 2022 |
AY4 2023 |
AY5 2024 |
FY1 2025 |
FY2 2026 |
FY3 2027 |
FY4 2028 |
FY5 2029 |
|---|---|---|---|---|---|---|---|---|---|---|
| Revenue | 6,651.0 | 7,001.0 | 8,151.0 | 8,191.0 | 8,837.0 | 8,964.3 | 9,093.5 | 9,224.5 | 9,357.4 | 9,492.3 |
| Revenue Growth, % | 0 | 5.26 | 16.43 | 0.49074 | 7.89 | 1.44 | 1.44 | 1.44 | 1.44 | 1.44 |
| EBITDA | 1,281.0 | 1,514.0 | 1,515.0 | 1,037.0 | 1,417.0 | 1,580.7 | 1,603.5 | 1,626.6 | 1,650.0 | 1,673.8 |
| EBITDA, % | 19.26 | 21.63 | 18.59 | 12.66 | 16.03 | 17.63 | 17.63 | 17.63 | 17.63 | 17.63 |
| Depreciation | 450.0 | 390.0 | 412.0 | 401.0 | 457.0 | 492.3 | 499.4 | 506.6 | 513.9 | 521.3 |
| Depreciation, % | 6.77 | 5.57 | 5.05 | 4.9 | 5.17 | 5.49 | 5.49 | 5.49 | 5.49 | 5.49 |
| EBIT | 831.0 | 1,124.0 | 1,103.0 | 636.0 | 960.0 | 1,088.4 | 1,104.1 | 1,120.0 | 1,136.2 | 1,152.5 |
| EBIT, % | 12.49 | 16.05 | 13.53 | 7.76 | 10.86 | 12.14 | 12.14 | 12.14 | 12.14 | 12.14 |
| Total Cash | 414.0 | 662.0 | 967.0 | 2,048.0 | 1,264.0 | 1,198.5 | 1,215.8 | 1,233.3 | 1,251.1 | 1,269.1 |
| Total Cash, percent | .0 | .0 | .0 | .0 | .0 | .0 | .0 | .0 | .0 | .0 |
| Account Receivables | 506.0 | 557.0 | 689.0 | 617.0 | 710.0 | 709.7 | 719.9 | 730.3 | 740.8 | 751.5 |
| Account Receivables, % | 7.61 | 7.96 | 8.45 | 7.53 | 8.03 | 7.92 | 7.92 | 7.92 | 7.92 | 7.92 |
| Inventories | 732.0 | 872.0 | 1,356.0 | 1,248.0 | 1,675.0 | 1,331.9 | 1,351.1 | 1,370.5 | 1,390.3 | 1,410.3 |
| Inventories, % | 11.01 | 12.46 | 16.64 | 15.24 | 18.95 | 14.86 | 14.86 | 14.86 | 14.86 | 14.86 |
| Accounts Payable | 2,271.0 | 2,857.0 | 3,858.0 | 3,358.0 | 4,141.0 | 3,767.6 | 3,821.8 | 3,876.9 | 3,932.8 | 3,989.4 |
| Accounts Payable, % | 34.15 | 40.81 | 47.33 | 41 | 46.86 | 42.03 | 42.03 | 42.03 | 42.03 | 42.03 |
| Capital Expenditure | -252.0 | -255.0 | -248.0 | -301.0 | -330.0 | -320.6 | -325.2 | -329.9 | -334.7 | -339.5 |
| Capital Expenditure, % | -3.79 | -3.64 | -3.04 | -3.67 | -3.73 | -3.58 | -3.58 | -3.58 | -3.58 | -3.58 |
| Tax Rate, % | 28.99 | 28.99 | 28.99 | 28.99 | 28.99 | 28.99 | 28.99 | 28.99 | 28.99 | 28.99 |
| EBITAT | 372.6 | 875.6 | 835.4 | 434.7 | 681.7 | 735.4 | 746.0 | 756.8 | 767.7 | 778.7 |
| Depreciation | ||||||||||
| Changes in Account Receivables | ||||||||||
| Changes in Inventories | ||||||||||
| Changes in Accounts Payable | ||||||||||
| Capital Expenditure | ||||||||||
| UFCF | 1,603.6 | 1,405.6 | 1,384.4 | 214.7 | 1,071.7 | 877.1 | 945.0 | 958.6 | 972.4 | 986.5 |
| WACC, % | 4.01 | 4.33 | 4.31 | 4.24 | 4.27 | 4.23 | 4.23 | 4.23 | 4.23 | 4.23 |
| PV UFCF | ||||||||||
| SUM PV UFCF | 4,183.5 | |||||||||
| Long Term Growth Rate, % | 3.00 | |||||||||
| Free cash flow (T + 1) | 1,016 | |||||||||
| Terminal Value | 82,450 | |||||||||
| Present Terminal Value | 67,016 | |||||||||
| Enterprise Value | 71,199 | |||||||||
| Net Debt | 4,304 | |||||||||
| Equity Value | 66,895 | |||||||||
| Diluted Shares Outstanding, MM | 495 | |||||||||
| Equity Value Per Share | 135.23 |
What You Will Receive
- Customizable Excel Template: An editable Excel-based DCF Calculator featuring pre-populated financial data for JDE Peet's N.V. (JDEPAS).
- Actual Market Data: Access to historical performance and forward-looking estimates (highlighted in the yellow cells).
- Adaptive Forecasting: Modify projection assumptions such as revenue growth, EBITDA %, and WACC as needed.
- Instant Calculations: Quickly observe how your inputs influence the valuation of JDE Peet's N.V. (JDEPAS).
- Professional Resource: Designed for investors, CFOs, consultants, and financial analysts.
- Intuitive Design: Organized for simplicity and ease of navigation, complete with step-by-step guidance.
Key Features
- Accurate JDE Peet's Financials: Gain access to comprehensive pre-loaded historical data and future forecasts.
- Adjustable Forecast Parameters: Modify the highlighted cells, including WACC, growth rates, and profit margins.
- Real-Time Calculations: Automatic updates for DCF, Net Present Value (NPV), and cash flow assessments.
- Intuitive Visual Dashboard: User-friendly charts and summaries to help you interpret your valuation outcomes.
- Designed for All Users: A straightforward, user-friendly layout tailored for investors, CFOs, and consultants alike.
How It Operates
- 1. Access the Template: Download and open the Excel file containing JDE Peet's (JDEPAS) preloaded data.
- 2. Modify Assumptions: Adjust essential inputs such as growth rates, WACC, and capital expenditures.
- 3. Observe Immediate Results: The DCF model automatically calculates intrinsic value and NPV in real-time.
- 4. Analyze Different Scenarios: Evaluate multiple forecasts to understand various valuation results.
- 5. Present with Assurance: Deliver professional valuation insights to bolster your decision-making process.
Why Opt for This Calculator?
- All-in-One Solution: Combines DCF, WACC, and financial ratio analyses seamlessly.
- Adjustable Parameters: Modify the yellow-highlighted fields to explore different scenarios.
- In-Depth Analysis: Automatically computes the intrinsic value and Net Present Value for JDE Peet's N.V. (JDEPAS).
- Preloaded Information: Comes with historical and projected data for a solid foundation.
- Expert-Level Tool: Perfect for financial analysts, investors, and business consultants.
Who Can Benefit from JDE Peet's N.V. (JDEPAS)?
- Investors: Make informed choices with a premier valuation tool tailored for the coffee and beverage industry.
- Financial Analysts: Streamline your analysis process with an easy-to-customize DCF model specifically designed for JDE Peet's N.V. (JDEPAS).
- Consultants: Effortlessly modify the template for client reports or presentations related to JDE Peet's N.V. (JDEPAS).
- Coffee Aficionados: Enhance your knowledge of valuation strategies using real-life cases from JDE Peet's N.V. (JDEPAS).
- Educators and Students: Utilize it as a hands-on resource in finance courses focusing on the beverage sector.
Components of the Template
- Pre-Filled DCF Model: JDE Peet's financial data preloaded for immediate analysis.
- WACC Calculator: Comprehensive calculations for Weighted Average Cost of Capital.
- Financial Ratios: Assess JDE Peet's profitability, leverage, and operational efficiency.
- Editable Inputs: Modify assumptions such as growth rates, margins, and CAPEX to match your scenarios.
- Financial Statements: Access annual and quarterly reports for in-depth scrutiny.
- Interactive Dashboard: Effortlessly visualize essential valuation metrics and outcomes.
Disclaimer
All information, articles, and product details provided on this website are for general informational and educational purposes only. We do not claim any ownership over, nor do we intend to infringe upon, any trademarks, copyrights, logos, brand names, or other intellectual property mentioned or depicted on this site. Such intellectual property remains the property of its respective owners, and any references here are made solely for identification or informational purposes, without implying any affiliation, endorsement, or partnership.
We make no representations or warranties, express or implied, regarding the accuracy, completeness, or suitability of any content or products presented. Nothing on this website should be construed as legal, tax, investment, financial, medical, or other professional advice. In addition, no part of this site—including articles or product references—constitutes a solicitation, recommendation, endorsement, advertisement, or offer to buy or sell any securities, franchises, or other financial instruments, particularly in jurisdictions where such activity would be unlawful.
All content is of a general nature and may not address the specific circumstances of any individual or entity. It is not a substitute for professional advice or services. Any actions you take based on the information provided here are strictly at your own risk. You accept full responsibility for any decisions or outcomes arising from your use of this website and agree to release us from any liability in connection with your use of, or reliance upon, the content or products found herein.