
|
J D Wetherspoon plc (JDW.L) Avaliação DCF |
Totalmente Editável: Adapte-Se Às Suas Necessidades No Excel Ou Planilhas
Design Profissional: Modelos Confiáveis E Padrão Da Indústria
Pré-Construídos Para Uso Rápido E Eficiente
Compatível com MAC/PC, totalmente desbloqueado
Não É Necessária Experiência; Fácil De Seguir
J D Wetherspoon plc (JDW.L) Bundle
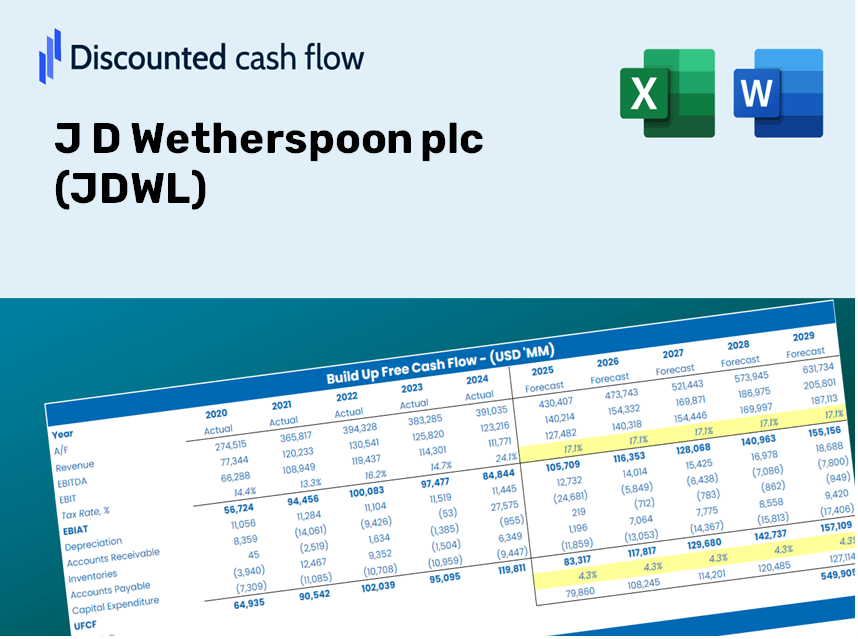
Aprimore sua estratégia de investimento com a calculadora DCF J D Wetherspoon PLC (JDWL)! Explore dados financeiros reais para JDW, ajuste as previsões e despesas do crescimento e observe instantaneamente como essas modificações afetam o valor intrínseco do JDWL.
What Awaits You
- Authentic JDWL Financial Data: Pre-filled with J D Wetherspoon plc's historical and forecasted data for accurate analysis.
- Completely Customizable Template: Easily adjust key variables such as revenue growth, WACC, and EBITDA %.
- Instant Calculations: Watch the intrinsic value of JDWL update in real-time as you make adjustments.
- Expert Valuation Tool: Tailored for investors, analysts, and consultants looking for reliable DCF results.
- Intuitive Design: A straightforward layout and clear guidelines suitable for all skill levels.
Key Features
- Pre-Loaded Data: J D Wetherspoon plc’s historical financial statements and pre-filled forecasts.
- Fully Adjustable Inputs: Customize WACC, tax rates, revenue growth, and EBITDA margins.
- Instant Results: Observe J D Wetherspoon plc’s intrinsic value update in real time.
- Clear Visual Outputs: Dashboard charts showcase valuation results and essential metrics.
- Built for Accuracy: A professional tool designed for analysts, investors, and finance specialists.
How It Works
- Download: Obtain the pre-configured Excel file containing J D Wetherspoon plc's (JDWL) financial data.
- Customize: Tailor your forecasts, including revenue growth, EBITDA %, and WACC values.
- Update Automatically: Watch as the intrinsic value and NPV calculations refresh in real-time.
- Test Scenarios: Generate various projections and instantly compare the results.
- Make Decisions: Utilize the valuation results to inform your investment strategy for J D Wetherspoon plc (JDWL).
Why Opt for This Calculator?
- Precision: Accurate financial data from JD Wetherspoon plc (JDWL) ensures reliable results.
- Versatility: Tailored for users to adjust and experiment with input values effortlessly.
- Efficient: Eliminate the need to create a DCF model from the ground up.
- Expert-Level: Crafted with the meticulousness and functionality expected by finance professionals.
- Intuitive: Simple to navigate, suitable for users without extensive financial modeling skills.
Who Should Utilize This Product?
- Investors: Evaluate the valuation of J D Wetherspoon plc (JDWL) before making stock transactions.
- CFOs and Financial Analysts: Enhance valuation methodologies and assess financial forecasts.
- Startup Founders: Discover how established public companies like J D Wetherspoon plc (JDWL) are appraised.
- Consultants: Provide accurate valuation reports to meet client needs.
- Students and Educators: Utilize real-world data for practicing and instructing on valuation strategies.
Overview of Template Features
- Preloaded JDWL Data: Historical and forecasted financial information, including revenue, EBIT, and capital expenditures.
- DCF and WACC Models: Professional-grade templates for determining intrinsic value and Weighted Average Cost of Capital.
- Customizable Inputs: Yellow-highlighted cells for modifying revenue growth, tax rates, and discount rates.
- Financial Statements: Detailed annual and quarterly financial statements for in-depth analysis.
- Key Ratios: Metrics for profitability, leverage, and efficiency used to assess performance.
- Dashboard and Charts: Visual representation of valuation results and underlying assumptions.
Disclaimer
All information, articles, and product details provided on this website are for general informational and educational purposes only. We do not claim any ownership over, nor do we intend to infringe upon, any trademarks, copyrights, logos, brand names, or other intellectual property mentioned or depicted on this site. Such intellectual property remains the property of its respective owners, and any references here are made solely for identification or informational purposes, without implying any affiliation, endorsement, or partnership.
We make no representations or warranties, express or implied, regarding the accuracy, completeness, or suitability of any content or products presented. Nothing on this website should be construed as legal, tax, investment, financial, medical, or other professional advice. In addition, no part of this site—including articles or product references—constitutes a solicitation, recommendation, endorsement, advertisement, or offer to buy or sell any securities, franchises, or other financial instruments, particularly in jurisdictions where such activity would be unlawful.
All content is of a general nature and may not address the specific circumstances of any individual or entity. It is not a substitute for professional advice or services. Any actions you take based on the information provided here are strictly at your own risk. You accept full responsibility for any decisions or outcomes arising from your use of this website and agree to release us from any liability in connection with your use of, or reliance upon, the content or products found herein.