
|
JPMorgan Global Growth & Renda plc (jggi.l) avaliação dcf |
Totalmente Editável: Adapte-Se Às Suas Necessidades No Excel Ou Planilhas
Design Profissional: Modelos Confiáveis E Padrão Da Indústria
Pré-Construídos Para Uso Rápido E Eficiente
Compatível com MAC/PC, totalmente desbloqueado
Não É Necessária Experiência; Fácil De Seguir
JPMorgan Global Growth & Income plc (JGGI.L) Bundle
Descubra o verdadeiro potencial do JPMorgan Global Growth & Renda plc (jggil) com nossa calculadora DCF avançada! Ajuste as principais suposições, explore vários cenários e avalie como as mudanças afetam o crescimento global do JPMorgan & Avaliação de renda plc (jggil) - Tudo dentro de um único modelo do Excel.
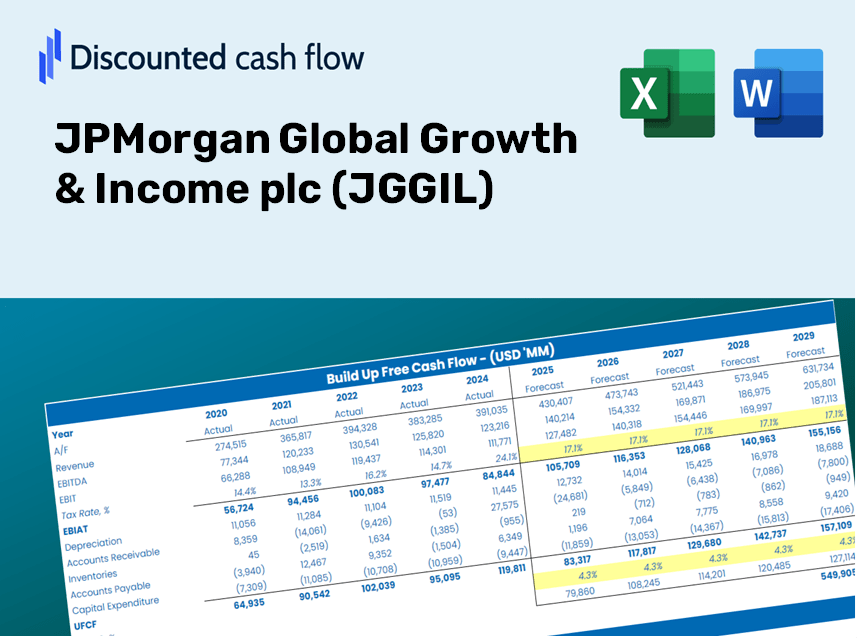
Discounted Cash Flow (DCF) - (USD MM)
| Year | AY1 2019 |
AY2 2020 |
AY3 2021 |
AY4 2022 |
AY5 2023 |
FY1 2024 |
FY2 2025 |
FY3 2026 |
FY4 2027 |
FY5 2028 |
|---|---|---|---|---|---|---|---|---|---|---|
| Revenue | 28.3 | 99.2 | 102.1 | 76.9 | 582.8 | 842.6 | 1,218.1 | 1,761.0 | 2,545.9 | 3,680.6 |
| Revenue Growth, % | 0 | 250.37 | 2.96 | -24.69 | 657.93 | 44.57 | 44.57 | 44.57 | 44.57 | 44.57 |
| EBITDA | .4 | 1.3 | -.4 | -2.7 | -10.8 | -5.2 | -7.6 | -11.0 | -15.8 | -22.9 |
| EBITDA, % | 1.38 | 1.31 | -0.42604 | -3.52 | -1.86 | -0.6224 | -0.6224 | -0.6224 | -0.6224 | -0.6224 |
| Depreciation | -28.6 | -155.8 | 26.0 | -177.4 | -573.6 | -628.4 | -908.5 | -1,313.4 | -1,898.8 | -2,745.1 |
| Depreciation, % | -100.88 | -157.11 | 25.51 | -230.75 | -98.42 | -74.58 | -74.58 | -74.58 | -74.58 | -74.58 |
| EBIT | 28.9 | 157.1 | -26.5 | 174.7 | 562.8 | 624.6 | 902.9 | 1,305.4 | 1,887.2 | 2,728.3 |
| EBIT, % | 102.26 | 158.41 | -25.93 | 227.23 | 96.56 | 74.13 | 74.13 | 74.13 | 74.13 | 74.13 |
| Total Cash | 5.3 | 55.9 | 42.0 | 160.7 | 178.3 | 415.7 | 600.9 | 868.7 | 1,255.9 | 1,815.7 |
| Total Cash, percent | .0 | .0 | .0 | .0 | .0 | .0 | .0 | .0 | .0 | .0 |
| Account Receivables | 12.4 | 7.2 | 3.3 | 2.8 | 9.6 | 100.4 | 145.1 | 209.8 | 303.3 | 438.5 |
| Account Receivables, % | 43.85 | 7.21 | 3.2 | 3.66 | 1.64 | 11.91 | 11.91 | 11.91 | 11.91 | 11.91 |
| Inventories | -.3 | -.5 | .0 | .0 | .0 | -2.7 | -3.9 | -5.6 | -8.1 | -11.7 |
| Inventories, % | -1.05 | -0.53447 | 0 | 0 | 0 | -0.31677 | -0.31677 | -0.31677 | -0.31677 | -0.31677 |
| Accounts Payable | 12.5 | 4.0 | 1.7 | 2.0 | 18.3 | 93.4 | 135.0 | 195.2 | 282.2 | 408.0 |
| Accounts Payable, % | 44.01 | 4.04 | 1.66 | 2.58 | 3.14 | 11.09 | 11.09 | 11.09 | 11.09 | 11.09 |
| Capital Expenditure | .0 | .0 | .0 | -2.8 | -.1 | -6.2 | -8.9 | -12.9 | -18.7 | -27.0 |
| Capital Expenditure, % | 0 | 0 | 0 | -3.65 | -0.02419264 | -0.73387 | -0.73387 | -0.73387 | -0.73387 | -0.73387 |
| Tax Rate, % | 0.97817 | 0.97817 | 0.97817 | 0.97817 | 0.97817 | 0.97817 | 0.97817 | 0.97817 | 0.97817 | 0.97817 |
| EBITAT | 27.8 | 155.8 | -28.0 | 170.4 | 557.3 | 614.3 | 888.2 | 1,284.0 | 1,856.3 | 2,683.6 |
| Depreciation | ||||||||||
| Changes in Account Receivables | ||||||||||
| Changes in Inventories | ||||||||||
| Changes in Accounts Payable | ||||||||||
| Capital Expenditure | ||||||||||
| UFCF | -.4 | -2.9 | -.9 | -9.0 | -6.9 | -33.3 | -31.2 | -45.1 | -65.2 | -94.2 |
| WACC, % | 7.67 | 7.67 | 7.67 | 7.67 | 7.67 | 7.67 | 7.67 | 7.67 | 7.67 | 7.67 |
| PV UFCF | ||||||||||
| SUM PV UFCF | -207.6 | |||||||||
| Long Term Growth Rate, % | 2.00 | |||||||||
| Free cash flow (T + 1) | -96 | |||||||||
| Terminal Value | -1,695 | |||||||||
| Present Terminal Value | -1,171 | |||||||||
| Enterprise Value | -1,379 | |||||||||
| Net Debt | -40 | |||||||||
| Equity Value | -1,339 | |||||||||
| Diluted Shares Outstanding, MM | 430 | |||||||||
| Equity Value Per Share | -311.77 |
Benefits You Will Receive
- Comprehensive Financial Model: Leverage JPMorgan Global Growth & Income plc's ([JGGIL]) actual performance data for a precise DCF valuation.
- Complete Forecasting Flexibility: Modify key factors such as revenue growth, profit margins, WACC, and other crucial metrics.
- Real-Time Calculations: Automated updates provide immediate insights as you adjust your inputs.
- Professional-Grade Template: An expertly crafted Excel file optimized for high-quality valuation outputs.
- Adaptable and Reusable: Designed for versatility, allowing for repeated application in comprehensive forecasting.
Key Features
- Comprehensive Historical Data: Access JPMorgan Global Growth & Income plc's (JGGIL) previous financial statements and detailed forecasts.
- Customizable Parameters: Modify inputs such as WACC, tax rates, revenue growth, and EBITDA margins.
- Real-Time Calculations: Watch the intrinsic value of JPMorgan Global Growth & Income plc (JGGIL) update instantly.
- Intuitive Visualizations: Dashboard charts present valuation results and important metrics clearly.
- Precision Engineered: A robust tool designed for analysts, investors, and financial professionals.
How It Works
- Download: Get the pre-built Excel file featuring JPMorgan Global Growth & Income plc’s (JGGIL) financial data.
- Customize: Modify forecasts to include revenue growth, EBITDA %, and WACC as per your analysis.
- Update Automatically: Watch as the intrinsic value and NPV calculations refresh in real-time.
- Test Scenarios: Generate various projections and instantly compare their results.
- Make Decisions: Leverage the valuation findings to inform your investment strategy.
Why Choose This Calculator for JPMorgan Global Growth & Income plc (JGGIL)?
- User-Friendly Interface: Suitable for both novices and experts in finance.
- Customizable Inputs: Easily adjust parameters to suit your financial analysis.
- Real-Time Valuation: Instantly observe changes in JGGIL’s valuation as inputs are modified.
- Preloaded Data: Includes JGGIL’s relevant financial data for swift evaluation.
- Relied Upon by Professionals: Frequently used by investors and analysts for strategic decision-making.
Who Can Benefit from This Product?
- Institutional Investors: Develop comprehensive and trustworthy valuation models for portfolio assessment related to JPMorgan Global Growth & Income plc (JGGIL).
- Corporate Finance Departments: Evaluate valuation scenarios to inform strategic decision-making within their organizations.
- Financial Consultants and Advisors: Deliver precise valuation insights to clients regarding JPMorgan Global Growth & Income plc (JGGIL).
- Students and Educators: Utilize real-time market data to practice and instruct on financial modeling techniques.
- Investment Enthusiasts: Gain a deeper understanding of how investment trusts like JPMorgan Global Growth & Income plc (JGGIL) are valued in the financial markets.
Contents of the Template
- Operating and Balance Sheet Data: Pre-filled historical data and forecasts for JPMorgan Global Growth & Income plc (JGGIL), including revenue, EBITDA, EBIT, and capital expenditures.
- WACC Calculation: A dedicated sheet for Weighted Average Cost of Capital (WACC), featuring parameters like Beta, risk-free rate, and share price.
- DCF Valuation (Unlevered and Levered): Customizable Discounted Cash Flow models displaying intrinsic value with comprehensive calculations.
- Financial Statements: Pre-loaded annual and quarterly financial statements to support thorough analysis.
- Key Ratios: Includes profitability, leverage, and efficiency ratios specifically for JPMorgan Global Growth & Income plc (JGGIL).
- Dashboard and Charts: Visual summary of valuation outputs and assumptions to facilitate easy analysis of results.
Disclaimer
All information, articles, and product details provided on this website are for general informational and educational purposes only. We do not claim any ownership over, nor do we intend to infringe upon, any trademarks, copyrights, logos, brand names, or other intellectual property mentioned or depicted on this site. Such intellectual property remains the property of its respective owners, and any references here are made solely for identification or informational purposes, without implying any affiliation, endorsement, or partnership.
We make no representations or warranties, express or implied, regarding the accuracy, completeness, or suitability of any content or products presented. Nothing on this website should be construed as legal, tax, investment, financial, medical, or other professional advice. In addition, no part of this site—including articles or product references—constitutes a solicitation, recommendation, endorsement, advertisement, or offer to buy or sell any securities, franchises, or other financial instruments, particularly in jurisdictions where such activity would be unlawful.
All content is of a general nature and may not address the specific circumstances of any individual or entity. It is not a substitute for professional advice or services. Any actions you take based on the information provided here are strictly at your own risk. You accept full responsibility for any decisions or outcomes arising from your use of this website and agree to release us from any liability in connection with your use of, or reliance upon, the content or products found herein.