
|
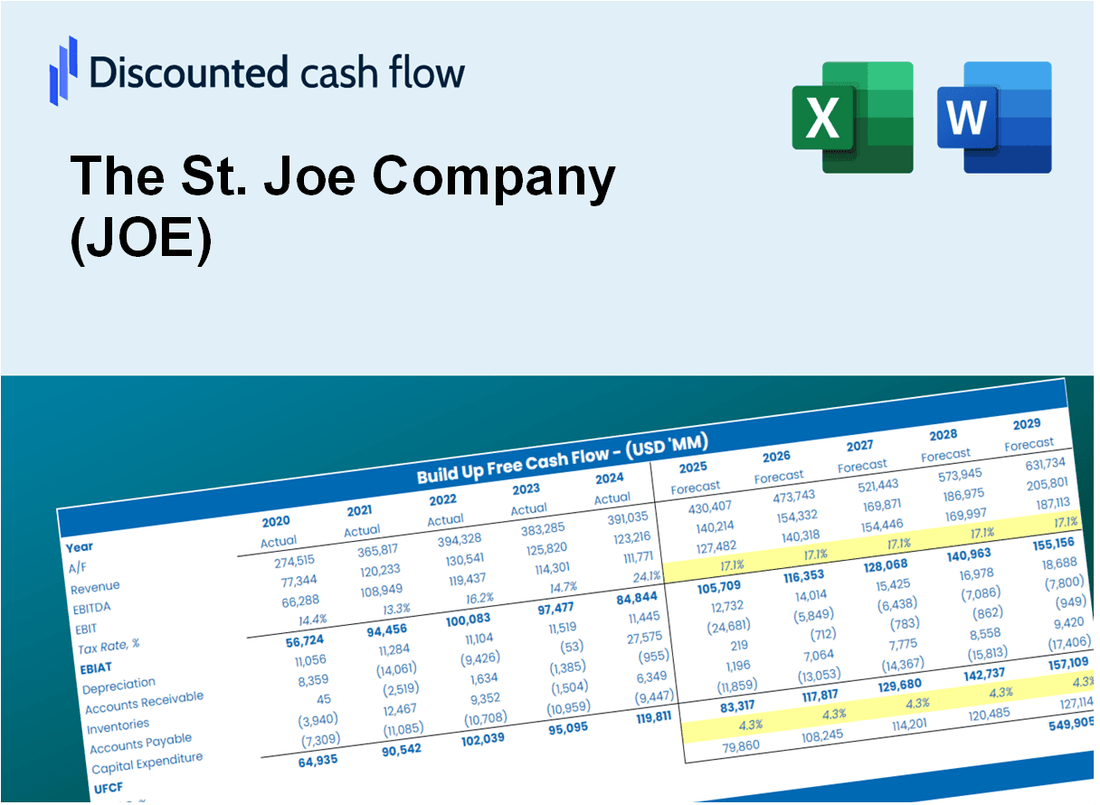
A Avaliação DCF da Companhia St. Joe (Joe) |
Totalmente Editável: Adapte-Se Às Suas Necessidades No Excel Ou Planilhas
Design Profissional: Modelos Confiáveis E Padrão Da Indústria
Pré-Construídos Para Uso Rápido E Eficiente
Compatível com MAC/PC, totalmente desbloqueado
Não É Necessária Experiência; Fácil De Seguir
The St. Joe Company (JOE) Bundle
Explore as perspectivas financeiras da St. Joe Company (Joe) com nossa calculadora DCF! Digite suas suposições de crescimento, margens e despesas para calcular o valor intrínseco da St. Joe Company (Joe) e aprimorar sua estratégia de investimento.
What You Will Receive
- Pre-Filled Financial Model: The St. Joe Company’s actual data allows for accurate DCF valuation.
- Comprehensive Forecast Control: Modify revenue growth, profit margins, WACC, and other essential factors.
- Real-Time Calculations: Automatic updates provide immediate results as you adjust parameters.
- Professional-Grade Template: A polished Excel file crafted for high-quality valuation.
- Flexible and Reusable: Designed for adaptability, enabling repeated application for in-depth forecasts.
Key Features
- Comprehensive JOE Data: Pre-filled with The St. Joe Company's historical performance metrics and future projections.
- Customizable Parameters: Modify revenue growth rates, profit margins, discount rates, tax implications, and capital investments.
- Interactive Valuation Model: Automatic recalculations of Net Present Value (NPV) and intrinsic value based on your specified inputs.
- Scenario Analysis: Develop various forecasting scenarios to explore different valuation possibilities.
- Intuitive Interface: Designed for ease of use, catering to both experienced professionals and newcomers.
How It Works
- 1. Access the Template: Download and open the Excel file featuring The St. Joe Company's (JOE) preloaded data.
- 2. Modify Assumptions: Adjust key variables such as growth projections, WACC, and capital expenditures.
- 3. Instant Results: The DCF model automatically computes intrinsic value and NPV in real time.
- 4. Explore Scenarios: Evaluate multiple forecasts to examine various valuation possibilities.
- 5. Present with Assurance: Deliver expert valuation insights to enhance your decision-making process.
Why Choose The St. Joe Company (JOE)?
- Exceptional Growth Potential: Invest in a company with a strong track record of development and expansion.
- Strategic Location: Benefit from properties situated in prime locations with high demand.
- Expert Management: Rely on a team with extensive experience in real estate and land development.
- Commitment to Sustainability: Engage with a company focused on environmentally responsible practices.
- Strong Community Engagement: Participate in a firm that values and invests in local communities.
Who Should Use This Product?
- Finance Students: Master valuation techniques and apply them using real data from The St. Joe Company (JOE).
- Academics: Integrate professional models into your coursework or research focused on The St. Joe Company (JOE).
- Investors: Validate your assumptions and analyze valuation outcomes for The St. Joe Company (JOE) stock.
- Analysts: Enhance your workflow with a pre-built, customizable DCF model tailored for The St. Joe Company (JOE).
- Small Business Owners: Understand the analytical methods used for evaluating large public companies like The St. Joe Company (JOE).
What the Template Contains
- Historical Data: Includes The St. Joe Company's past financials and baseline forecasts.
- DCF and Levered DCF Models: Detailed templates to calculate The St. Joe Company's intrinsic value.
- WACC Sheet: Pre-built calculations for Weighted Average Cost of Capital.
- Editable Inputs: Modify key drivers like growth rates, EBITDA %, and CAPEX assumptions.
- Quarterly and Annual Statements: A complete breakdown of The St. Joe Company's financials.
- Interactive Dashboard: Visualize valuation results and projections dynamically.
Disclaimer
All information, articles, and product details provided on this website are for general informational and educational purposes only. We do not claim any ownership over, nor do we intend to infringe upon, any trademarks, copyrights, logos, brand names, or other intellectual property mentioned or depicted on this site. Such intellectual property remains the property of its respective owners, and any references here are made solely for identification or informational purposes, without implying any affiliation, endorsement, or partnership.
We make no representations or warranties, express or implied, regarding the accuracy, completeness, or suitability of any content or products presented. Nothing on this website should be construed as legal, tax, investment, financial, medical, or other professional advice. In addition, no part of this site—including articles or product references—constitutes a solicitation, recommendation, endorsement, advertisement, or offer to buy or sell any securities, franchises, or other financial instruments, particularly in jurisdictions where such activity would be unlawful.
All content is of a general nature and may not address the specific circumstances of any individual or entity. It is not a substitute for professional advice or services. Any actions you take based on the information provided here are strictly at your own risk. You accept full responsibility for any decisions or outcomes arising from your use of this website and agree to release us from any liability in connection with your use of, or reliance upon, the content or products found herein.