
|
JSW Infrastructure Limited (JSWINFRA.NS) Avaliação DCF |
Totalmente Editável: Adapte-Se Às Suas Necessidades No Excel Ou Planilhas
Design Profissional: Modelos Confiáveis E Padrão Da Indústria
Pré-Construídos Para Uso Rápido E Eficiente
Compatível com MAC/PC, totalmente desbloqueado
Não É Necessária Experiência; Fácil De Seguir
JSW Infrastructure Limited (JSWINFRA.NS) Bundle
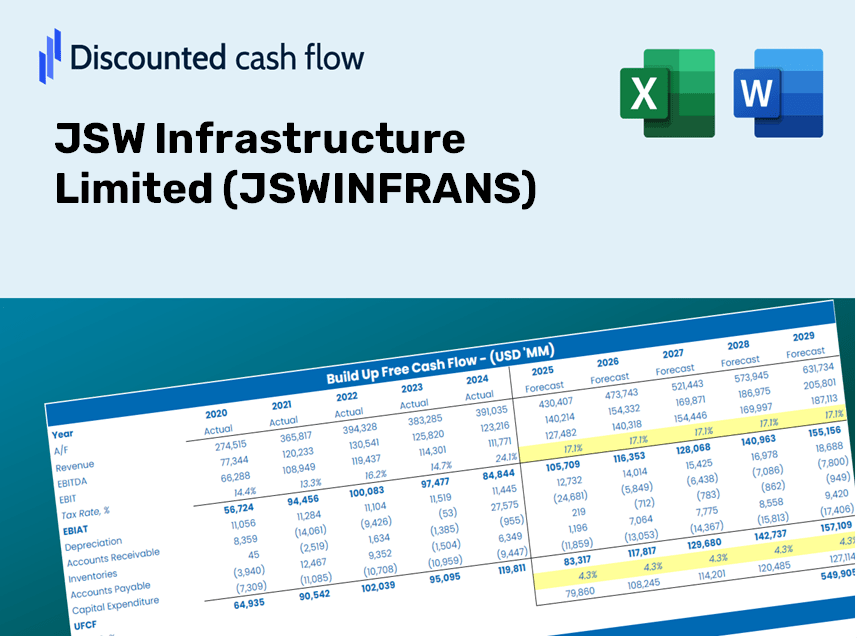
Explore as perspectivas financeiras da JSW Infrastructure Limited (JSWINFRANS) com nossa calculadora DCF amigável! Digite suas suposições de crescimento, margens e despesas para calcular o valor intrínseco da JSW Infrastructure Limited (JSWINFRANS) e informe suas decisões de investimento.
Discounted Cash Flow (DCF) - (USD MM)
| Year | AY1 2021 |
AY2 2022 |
AY3 2023 |
AY4 2024 |
AY5 2025 |
FY1 2026 |
FY2 2027 |
FY3 2028 |
FY4 2029 |
FY5 2030 |
|---|---|---|---|---|---|---|---|---|---|---|
| Revenue | 15,783.3 | 22,473.0 | 31,552.3 | 37,628.9 | 44,761.4 | 58,301.7 | 75,937.9 | 98,909.1 | 128,829.0 | 167,799.7 |
| Revenue Growth, % | 0 | 42.39 | 40.4 | 19.26 | 18.95 | 30.25 | 30.25 | 30.25 | 30.25 | 30.25 |
| EBITDA | 9,084.6 | 10,388.3 | 14,709.5 | 21,906.7 | 26,894.9 | 31,332.1 | 40,810.1 | 53,155.1 | 69,234.4 | 90,177.8 |
| EBITDA, % | 57.56 | 46.23 | 46.62 | 58.22 | 60.09 | 53.74 | 53.74 | 53.74 | 53.74 | 53.74 |
| Depreciation | 2,706.6 | 3,248.6 | 3,912.3 | 4,364.8 | 5,465.5 | 7,907.2 | 10,299.2 | 13,414.7 | 17,472.6 | 22,758.1 |
| Depreciation, % | 17.15 | 14.46 | 12.4 | 11.6 | 12.21 | 13.56 | 13.56 | 13.56 | 13.56 | 13.56 |
| EBIT | 6,378.1 | 7,139.7 | 10,797.2 | 17,541.9 | 21,429.4 | 23,424.9 | 30,510.9 | 39,740.4 | 51,761.8 | 67,419.7 |
| EBIT, % | 40.41 | 31.77 | 34.22 | 46.62 | 47.87 | 40.18 | 40.18 | 40.18 | 40.18 | 40.18 |
| Total Cash | 2,548.1 | 10,261.5 | 19,257.1 | 41,886.1 | 27,838.8 | 33,235.7 | 43,289.4 | 56,384.4 | 73,440.7 | 95,656.5 |
| Total Cash, percent | .0 | .0 | .0 | .0 | .0 | .0 | .0 | .0 | .0 | .0 |
| Account Receivables | 9,961.9 | 11,572.8 | 4,023.7 | 7,482.3 | 8,090.3 | 19,277.4 | 25,108.8 | 32,704.2 | 42,597.2 | 55,482.9 |
| Account Receivables, % | 63.12 | 51.5 | 12.75 | 19.88 | 18.07 | 33.06 | 33.06 | 33.06 | 33.06 | 33.06 |
| Inventories | 991.5 | 854.1 | 1,021.6 | 1,117.4 | 1,338.0 | 2,248.0 | 2,928.0 | 3,813.7 | 4,967.3 | 6,469.9 |
| Inventories, % | 6.28 | 3.8 | 3.24 | 2.97 | 2.99 | 3.86 | 3.86 | 3.86 | 3.86 | 3.86 |
| Accounts Payable | 2,151.4 | 2,747.9 | 3,015.9 | 3,562.2 | 3,493.6 | 6,143.7 | 8,002.1 | 10,422.7 | 13,575.6 | 17,682.2 |
| Accounts Payable, % | 13.63 | 12.23 | 9.56 | 9.47 | 7.8 | 10.54 | 10.54 | 10.54 | 10.54 | 10.54 |
| Capital Expenditure | -17,226.1 | -5,090.8 | -2,793.7 | -2,487.1 | -20,755.7 | -21,511.7 | -28,019.0 | -36,494.7 | -47,534.3 | -61,913.4 |
| Capital Expenditure, % | -109.14 | -22.65 | -8.85 | -6.61 | -46.37 | -36.9 | -36.9 | -36.9 | -36.9 | -36.9 |
| Tax Rate, % | 16.63 | 16.63 | 16.63 | 16.63 | 16.63 | 16.63 | 16.63 | 16.63 | 16.63 | 16.63 |
| EBITAT | 4,733.5 | 5,496.6 | 9,849.8 | 13,840.6 | 17,866.3 | 18,960.1 | 24,695.5 | 32,165.8 | 41,896.0 | 54,569.5 |
| Depreciation | ||||||||||
| Changes in Account Receivables | ||||||||||
| Changes in Inventories | ||||||||||
| Changes in Accounts Payable | ||||||||||
| Capital Expenditure | ||||||||||
| UFCF | -18,588.1 | 2,777.4 | 18,618.0 | 12,710.2 | 1,678.9 | -4,091.4 | 2,322.7 | 3,025.3 | 3,940.5 | 5,132.5 |
| WACC, % | 9.19 | 9.2 | 9.28 | 9.21 | 9.24 | 9.22 | 9.22 | 9.22 | 9.22 | 9.22 |
| PV UFCF | ||||||||||
| SUM PV UFCF | 6,593.3 | |||||||||
| Long Term Growth Rate, % | 2.00 | |||||||||
| Free cash flow (T + 1) | 5,235 | |||||||||
| Terminal Value | 72,471 | |||||||||
| Present Terminal Value | 46,621 | |||||||||
| Enterprise Value | 53,214 | |||||||||
| Net Debt | 44,309 | |||||||||
| Equity Value | 8,905 | |||||||||
| Diluted Shares Outstanding, MM | 2,100 | |||||||||
| Equity Value Per Share | 4.24 |
What You Will Receive
- Customizable Excel Template: A fully adaptable Excel-based DCF Calculator featuring pre-filled financial data for JSW Infrastructure Limited (JSWINFRANS).
- Authentic Data: Historical performance metrics and projected estimates (highlighted in the yellow cells).
- Flexible Forecasting: Modify key assumptions such as revenue growth, EBITDA %, and WACC.
- Instant Calculations: Quickly observe how your inputs affect JSW Infrastructure Limited's valuation.
- Professional Resource: Designed for investors, CFOs, consultants, and financial analysts.
- User-Centric Format: Organized for straightforward navigation and ease of use, complete with detailed instructions.
Key Features
- Pre-Loaded Data: Historical financial statements and pre-filled forecasts for JSW Infrastructure Limited (JSWINFRANS).
- Fully Adjustable Inputs: Modify WACC, tax rates, revenue growth, and EBITDA margins as needed.
- Instant Results: View JSW Infrastructure's intrinsic value recalculating in real time.
- Clear Visual Outputs: Dashboard charts showcase valuation results and essential metrics.
- Built for Accuracy: A professional tool tailored for analysts, investors, and finance experts.
How It Works
- Step 1: Download the Excel file.
- Step 2: Examine the pre-filled JSW Infrastructure Limited (JSWINFRANS) data (both historical and projected).
- Step 3: Modify the key assumptions (highlighted in yellow) according to your analysis.
- Step 4: Observe the automatic recalculations reflecting the intrinsic value of JSW Infrastructure Limited (JSWINFRANS).
- Step 5: Utilize the results for your investment decisions or reporting needs.
Why Select This Calculator for JSW Infrastructure Limited (JSWINFRANS)?
- Designed for Experts: A sophisticated tool utilized by analysts, CFOs, and consultants.
- Accurate Data: JSW Infrastructure's historical and projected financials are preloaded for precision.
- Scenario Analysis: Effortlessly model various forecasts and assumptions.
- Clear Results: Instantly computes intrinsic value, NPV, and essential metrics.
- User-Friendly: Comprehensive step-by-step instructions simplify the process.
Who Should Use JSW Infrastructure Limited (JSWINFRANS)?
- Investors: Evaluate the fair value of JSW Infrastructure Limited (JSWINFRANS) to make informed investment choices.
- CFOs: Utilize a sophisticated DCF model for accurate financial reporting and analysis.
- Consultants: Seamlessly customize the template for client valuation reports.
- Entrepreneurs: Discover financial modeling techniques employed by leading industry players.
- Educators: Implement it as a resource to teach valuation methods effectively.
Contents of the Template
- Pre-Filled DCF Model: JSW Infrastructure Limited’s financial data preloaded for immediate analysis.
- WACC Calculator: Comprehensive calculations for Weighted Average Cost of Capital.
- Financial Ratios: Assess JSW Infrastructure Limited’s profitability, leverage, and operational efficiency.
- Editable Inputs: Adjust assumptions such as growth rates, margins, and capital expenditures to suit your scenarios.
- Financial Statements: Annual and quarterly reports provided for in-depth analysis.
- Interactive Dashboard: Effortlessly visualize key valuation metrics and outcomes.
Disclaimer
All information, articles, and product details provided on this website are for general informational and educational purposes only. We do not claim any ownership over, nor do we intend to infringe upon, any trademarks, copyrights, logos, brand names, or other intellectual property mentioned or depicted on this site. Such intellectual property remains the property of its respective owners, and any references here are made solely for identification or informational purposes, without implying any affiliation, endorsement, or partnership.
We make no representations or warranties, express or implied, regarding the accuracy, completeness, or suitability of any content or products presented. Nothing on this website should be construed as legal, tax, investment, financial, medical, or other professional advice. In addition, no part of this site—including articles or product references—constitutes a solicitation, recommendation, endorsement, advertisement, or offer to buy or sell any securities, franchises, or other financial instruments, particularly in jurisdictions where such activity would be unlawful.
All content is of a general nature and may not address the specific circumstances of any individual or entity. It is not a substitute for professional advice or services. Any actions you take based on the information provided here are strictly at your own risk. You accept full responsibility for any decisions or outcomes arising from your use of this website and agree to release us from any liability in connection with your use of, or reliance upon, the content or products found herein.