
|
JTC PLC (JTC.L) Avaliação DCF |
Totalmente Editável: Adapte-Se Às Suas Necessidades No Excel Ou Planilhas
Design Profissional: Modelos Confiáveis E Padrão Da Indústria
Pré-Construídos Para Uso Rápido E Eficiente
Compatível com MAC/PC, totalmente desbloqueado
Não É Necessária Experiência; Fácil De Seguir
JTC Plc (JTC.L) Bundle
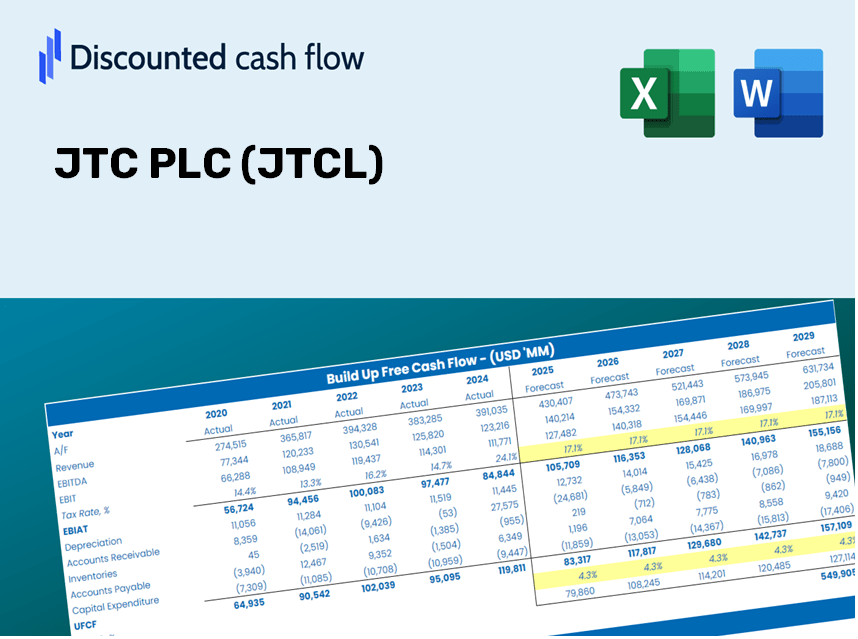
Obtenha uma visão da sua análise de avaliação do JTC PLC (JTCL) com a nossa calculadora DCF de ponta! Carregado com dados JTCL reais, este modelo do Excel permite ajustar as previsões e suposições para o cálculo preciso do valor intrínseco JTC PLC (JTCL).
Discounted Cash Flow (DCF) - (USD MM)
| Year | AY1 2020 |
AY2 2021 |
AY3 2022 |
AY4 2023 |
AY5 2024 |
FY1 2025 |
FY2 2026 |
FY3 2027 |
FY4 2028 |
FY5 2029 |
|---|---|---|---|---|---|---|---|---|---|---|
| Revenue | 115.1 | 147.5 | 200.0 | 257.4 | 305.4 | 390.2 | 498.6 | 637.1 | 814.0 | 1,040.1 |
| Revenue Growth, % | 0 | 28.16 | 35.62 | 28.7 | 18.62 | 27.77 | 27.77 | 27.77 | 27.77 | 27.77 |
| EBITDA | 28.1 | 49.3 | 65.2 | 67.1 | 47.1 | 102.9 | 131.5 | 168.0 | 214.7 | 274.4 |
| EBITDA, % | 24.41 | 33.4 | 32.58 | 26.06 | 15.43 | 26.38 | 26.38 | 26.38 | 26.38 | 26.38 |
| Depreciation | 13.8 | 17.6 | 22.3 | 25.1 | 30.1 | 42.7 | 54.6 | 69.7 | 89.1 | 113.8 |
| Depreciation, % | 12.03 | 11.93 | 11.13 | 9.77 | 9.86 | 10.94 | 10.94 | 10.94 | 10.94 | 10.94 |
| EBIT | 14.3 | 31.7 | 42.9 | 41.9 | 17.0 | 60.2 | 77.0 | 98.3 | 125.6 | 160.5 |
| EBIT, % | 12.38 | 21.48 | 21.46 | 16.29 | 5.57 | 15.44 | 15.44 | 15.44 | 15.44 | 15.44 |
| Total Cash | 31.1 | 39.3 | 48.9 | 97.2 | 64.7 | 107.0 | 136.7 | 174.6 | 223.1 | 285.1 |
| Total Cash, percent | .0 | .0 | .0 | .0 | .0 | .0 | .0 | .0 | .0 | .0 |
| Account Receivables | 35.8 | 51.2 | 62.4 | 70.3 | 92.9 | 120.8 | 154.3 | 197.2 | 251.9 | 321.9 |
| Account Receivables, % | 31.15 | 34.73 | 31.17 | 27.29 | 30.41 | 30.95 | 30.95 | 30.95 | 30.95 | 30.95 |
| Inventories | 11.4 | 12.8 | 12.5 | .5 | 15.4 | 23.5 | 30.1 | 38.4 | 49.1 | 62.7 |
| Inventories, % | 9.93 | 8.7 | 6.26 | 0.20782 | 5.04 | 6.03 | 6.03 | 6.03 | 6.03 | 6.03 |
| Accounts Payable | 2.0 | 2.1 | 2.7 | 1.3 | 2.9 | 4.6 | 5.9 | 7.6 | 9.7 | 12.3 |
| Accounts Payable, % | 1.71 | 1.42 | 1.36 | 0.48749 | 0.95519 | 1.19 | 1.19 | 1.19 | 1.19 | 1.19 |
| Capital Expenditure | -4.4 | -4.0 | -8.5 | -6.2 | -9.6 | -12.7 | -16.2 | -20.8 | -26.5 | -33.9 |
| Capital Expenditure, % | -3.82 | -2.71 | -4.23 | -2.39 | -3.13 | -3.26 | -3.26 | -3.26 | -3.26 | -3.26 |
| Tax Rate, % | 1.97 | 1.97 | 1.97 | 1.97 | 1.97 | 1.97 | 1.97 | 1.97 | 1.97 | 1.97 |
| EBITAT | 13.4 | 30.4 | 41.5 | 37.7 | 16.7 | 57.1 | 73.0 | 93.2 | 119.1 | 152.2 |
| Depreciation | ||||||||||
| Changes in Account Receivables | ||||||||||
| Changes in Inventories | ||||||||||
| Changes in Accounts Payable | ||||||||||
| Capital Expenditure | ||||||||||
| UFCF | -22.5 | 27.3 | 45.1 | 59.2 | 1.4 | 52.8 | 72.5 | 92.6 | 118.3 | 151.2 |
| WACC, % | 7.51 | 7.53 | 7.53 | 7.48 | 7.55 | 7.52 | 7.52 | 7.52 | 7.52 | 7.52 |
| PV UFCF | ||||||||||
| SUM PV UFCF | 380.0 | |||||||||
| Long Term Growth Rate, % | 2.00 | |||||||||
| Free cash flow (T + 1) | 154 | |||||||||
| Terminal Value | 2,793 | |||||||||
| Present Terminal Value | 1,944 | |||||||||
| Enterprise Value | 2,324 | |||||||||
| Net Debt | 258 | |||||||||
| Equity Value | 2,066 | |||||||||
| Diluted Shares Outstanding, MM | 163 | |||||||||
| Equity Value Per Share | 1,264.92 |
What You Will Receive
- Actual JTC PLC Data: Preloaded financial metrics – including revenue and EBIT – based on authentic and forecasted figures.
- Comprehensive Customization: Modify all key variables (yellow cells) such as WACC, growth %, and tax rates.
- Real-Time Valuation Updates: Automatic recalculations to assess the effects of changes on JTC PLC's fair value.
- Flexible Excel Template: Designed for quick adjustments, scenario analysis, and detailed forecasting.
- Efficient and Accurate: Eliminate the need to build models from the ground up while ensuring precision and adaptability.
Core Features
- Pre-Configured Data: JTC PLC’s historical financial records and ready-made projections.
- Completely Customizable Inputs: Modify WACC, tax rates, revenue growth, and EBITDA margins as needed.
- Real-Time Results: Observe JTC PLC’s intrinsic value update instantly.
- Intuitive Visual Outputs: Dashboard graphs illustrate valuation results and essential metrics.
- Designed for Precision: A professional-grade tool for analysts, investors, and finance specialists.
How It Works
- Step 1: Download the Excel file.
- Step 2: Examine the pre-filled JTC PLC (JTCL) data (historical and projected).
- Step 3: Modify key assumptions (yellow cells) in alignment with your analysis.
- Step 4: Observe the automatic recalculations for JTC PLC’s intrinsic value.
- Step 5: Utilize the results for investment decisions or reporting.
Why Choose This Calculator for JTC PLC (JTCL)?
- Accurate Data: Up-to-date JTC PLC financials provide dependable valuation results.
- Customizable: Modify essential parameters such as growth rates, WACC, and tax rates to align with your forecasts.
- Time-Saving: Pre-configured calculations streamline the process, allowing you to bypass starting from scratch.
- Professional-Grade Tool: Tailored for investors, analysts, and consultants in the field.
- User-Friendly: An intuitive design and clear step-by-step guidance make it accessible for everyone.
Who Can Benefit from This Product?
- Investors: Accurately assess the fair value of JTC PLC (JTCL) before making investment moves.
- CFOs: Utilize a high-level DCF model for comprehensive financial reporting and analysis.
- Consultants: Easily tailor the template for client valuation reports.
- Entrepreneurs: Acquire insights into the financial modeling techniques employed by leading corporations.
- Educators: Employ it as a resource to illustrate valuation methodologies in the classroom.
Contents of the Template
- Historical Data: Contains past financial information and baseline forecasts for JTC PLC (JTCL).
- DCF and Levered DCF Models: Comprehensive templates designed to determine the intrinsic value of JTC PLC (JTCL).
- WACC Sheet: Pre-constructed calculations for the Weighted Average Cost of Capital.
- Editable Inputs: Adjust key variables such as growth rates, EBITDA percentages, and CAPEX assumptions.
- Quarterly and Annual Statements: A thorough analysis of the financial performance of JTC PLC (JTCL).
- Interactive Dashboard: A dynamic interface to visualize valuation results and forecasts.
Disclaimer
All information, articles, and product details provided on this website are for general informational and educational purposes only. We do not claim any ownership over, nor do we intend to infringe upon, any trademarks, copyrights, logos, brand names, or other intellectual property mentioned or depicted on this site. Such intellectual property remains the property of its respective owners, and any references here are made solely for identification or informational purposes, without implying any affiliation, endorsement, or partnership.
We make no representations or warranties, express or implied, regarding the accuracy, completeness, or suitability of any content or products presented. Nothing on this website should be construed as legal, tax, investment, financial, medical, or other professional advice. In addition, no part of this site—including articles or product references—constitutes a solicitation, recommendation, endorsement, advertisement, or offer to buy or sell any securities, franchises, or other financial instruments, particularly in jurisdictions where such activity would be unlawful.
All content is of a general nature and may not address the specific circumstances of any individual or entity. It is not a substitute for professional advice or services. Any actions you take based on the information provided here are strictly at your own risk. You accept full responsibility for any decisions or outcomes arising from your use of this website and agree to release us from any liability in connection with your use of, or reliance upon, the content or products found herein.