
|
Kellogg Company (K): ANSOFF MATRIX ANÁLISE [JAN-2025 Atualizada] |
Totalmente Editável: Adapte-Se Às Suas Necessidades No Excel Ou Planilhas
Design Profissional: Modelos Confiáveis E Padrão Da Indústria
Pré-Construídos Para Uso Rápido E Eficiente
Compatível com MAC/PC, totalmente desbloqueado
Não É Necessária Experiência; Fácil De Seguir
Kellogg Company (K) Bundle
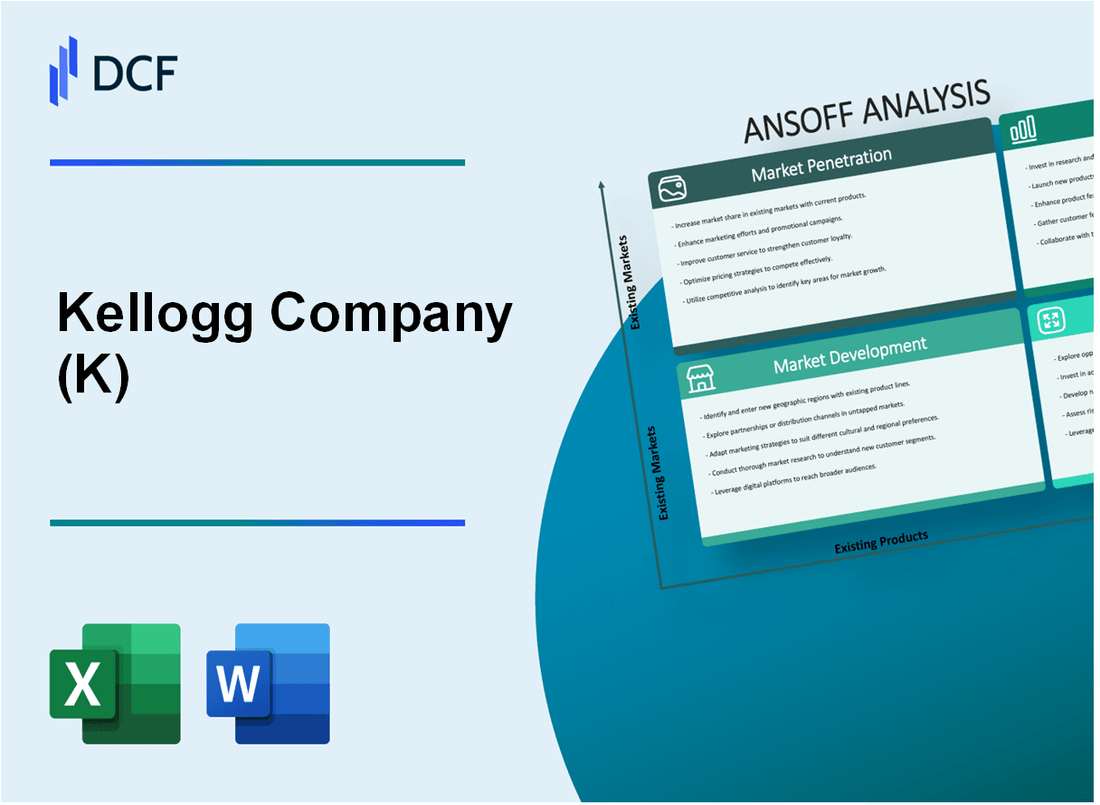
No mundo dinâmico da inovação do café da manhã, a Kellogg Company está em uma encruzilhada estratégica, alavancando a poderosa matriz de Ansoff para reimaginar sua trajetória de crescimento. Ao explorar meticulosamente a penetração do mercado, o desenvolvimento, a inovação de produtos e as estratégias de diversificação em negrito, a Kellogg não está apenas vendendo cereais-cria uma visão transformadora que preenche as experiências tradicionais de café da manhã com nutrição de ponta e preferências do consumidor. De alternativas baseadas em plantas às tecnologias de saúde digital, a empresa está pronta para redefinir o cenário global de alimentos, desafiando os limites convencionais e estabelecendo novos padrões do setor.
Kellogg Company (K) - Ansoff Matrix: Penetração de mercado
Aumentar os gastos de marketing para as principais marcas de cereais de café da manhã
Em 2022, as despesas de marketing da Kellogg totalizaram US $ 1,3 bilhão, com uma alocação específica de US $ 456 milhões para marcas principais de cereais de café da manhã, como flocos de fosco e K. especial.
| Marca | Gasto de marketing 2022 | Quota de mercado |
|---|---|---|
| Flocos geada | US $ 189 milhões | 22.4% |
| Especial k | US $ 167 milhões | 15.6% |
Desenvolva campanhas de publicidade digital direcionadas
As despesas com publicidade digital atingiram US $ 287 milhões em 2022, visando a geração do milênio e os consumidores da geração Z.
- Os gastos com anúncios digitais aumentaram 14,3% ano a ano
- O envolvimento da mídia social cresceu 22% para as marcas de cereais de café da manhã
- Campanhas direcionadas geraram 3,7 milhões de novas impressões digitais
Implementar estratégias de preços promocionais
A Kellogg implementou promoções de preços que resultaram em um aumento de 6,2% nas vendas de unidades para segmentos de clientes sensíveis ao preço.
| Tipo de promoção | Desconto médio | Impacto de vendas |
|---|---|---|
| Descontos de compra em massa | 15% | +4,5% de volume de vendas |
| Descontos do programa de fidelidade | 12% | +1,7% de volume de vendas |
Expandir canais de distribuição
A rede de distribuição expandiu -se para 85.000 locais de varejo em 2022, representando um aumento de 7,3% em relação ao ano anterior.
- Adicionado 6.200 novas parcerias de mercearias
- Aumento da presença de varejo on -line em 18,5%
- Distribuição internacional expandida em 12 novos mercados
Lançar programas de fidelidade do consumidor
A associação ao programa de fidelidade atingiu 2,9 milhões de membros em 2022, gerando US $ 214 milhões em receita de compra repetida.
| Métrica do Programa de Fidelidade | 2022 Performance |
|---|---|
| Total de membros | 2,9 milhões |
| Repita a taxa de compra | 37.6% |
| Receita do Programa de Fidelidade | US $ 214 milhões |
Kellogg Company (K) - Anoff Matrix: Desenvolvimento de Mercado
Expandir a presença internacional em mercados emergentes
A Kellogg Company registrou vendas líquidas de US $ 14,2 bilhões em 2022, com mercados internacionais contribuindo com 35% da receita total. Na Índia, a participação de mercado da Kellogg atingiu 4,5% no segmento de cereais do café da manhã em 2022. A expansão do mercado do Sudeste Asiático resultou em um crescimento de 7,2% nas vendas regionais durante o mesmo período.
| Mercado | Crescimento de vendas | Ano de entrada no mercado |
|---|---|---|
| Índia | 5.3% | 2000 |
| Indonésia | 6.8% | 2005 |
| Vietnã | 4.5% | 2010 |
Desenvolva variações de produtos específicas da região
A Kellogg investiu US $ 42 milhões em P&D de localização de produtos em 2022. Variações de produtos desenvolvidas:
- Índia: variante de aveia masala
- Indonésia: cereais certificados por halal
- Sudeste Asiático: opções de café da manhã com baixo teor de açúcar
Alvo consumidores conscientes da saúde
A linha de produtos focada na saúde gerou US $ 1,3 bilhão em receita, representando 9,2% do total de vendas em 2022. Os lançamentos de novos produtos incluíram:
- Cereais enriquecidos com proteínas
- Opções sem glúten
- Produtos de café da manhã orgânico
Estabelecer parcerias estratégicas
A Kellogg formou 12 novas parcerias de varejo em mercados emergentes em 2022. Os investimentos em parceria totalizaram US $ 25,7 milhões, com retornos projetados de 15,3% em três anos.
| País | Parceiro de varejo | Valor da parceria |
|---|---|---|
| Índia | Big Bazaar | US $ 5,2 milhões |
| Indonésia | Grupo de varejo moderno | US $ 4,8 milhões |
Aproveite as plataformas de comércio eletrônico
As vendas de comércio eletrônico atingiram US $ 680 milhões em 2022, um aumento de 22,5% em relação a 2021. Penetração do mercado on-line em mercados emergentes:
- Índia: 14,3% de participação de mercado
- Sudeste Asiático: 11,7% de participação de mercado
O investimento em marketing digital totalizou US $ 53 milhões em 2022, visando segmentos de consumidores on -line em mercados emergentes.
Kellogg Company (K) - Ansoff Matrix: Desenvolvimento de Produtos
Crie linhas de produtos de café da manhã à base de proteínas à base de plantas e alternativas
Em 2022, o segmento de produtos baseado em vegetais da Kellogg gerou US $ 340 milhões em receita. A empresa lançou a linha de produtos baseados em plantas da Incogmeato com investimento de US $ 100 milhões. O mercado alternativo de proteínas deve atingir US $ 85,6 bilhões até 2030.
| Linha de produtos | Investimento | Potencial de mercado |
|---|---|---|
| Incogmeato | US $ 100 milhões | US $ 85,6 bilhões até 2030 |
Desenvolver variantes de cereais focadas em nutrição com baixo teor de açúcar e funcionais
A Kellogg investiu US $ 50 milhões no desenvolvimento de linhas de cereais com baixo teor de açúcar. O mercado de nutrição funcional projetada para atingir US $ 24,3 bilhões até 2025.
- Proteína K Especial Plus: Proteína 10g por porção
- Saúde digestiva de toda a rubran: 10g de fibra por porção
- Variantes de baixo açúcar reduziram o teor de açúcar em 30%
Introduzir opções convenientes de café da manhã e lanches em movimento
O segmento on-the-go da Kellogg gerou US $ 450 milhões em 2022. O mercado de barras de café da manhã deve atingir US $ 7,2 bilhões até 2026.
| Categoria de produto | Receita | Crescimento do mercado |
|---|---|---|
| Barras de café da manhã | US $ 450 milhões | US $ 7,2 bilhões até 2026 |
Inovar projetos de embalagens para atrair consumidores preocupados com a saúde
A Kellogg alocou US $ 75 milhões para inovações de embalagens sustentáveis. O mercado de embalagens ecológico projetado para atingir US $ 237,8 bilhões até 2024.
- Embalagem 100% reciclável
- Conteúdo plástico reduzido em 40%
- Iniciativas de embalagem neutra em carbono
Desenvolva experiências de produtos digitais com embalagens interativas
O investimento em tecnologia de embalagens digitais atingiu US $ 25 milhões. O mercado de embalagens inteligentes deve crescer para US $ 39,7 bilhões até 2027.
| Inovação digital | Investimento | Potencial de mercado |
|---|---|---|
| Embalagem interativa | US $ 25 milhões | US $ 39,7 bilhões até 2027 |
Kellogg Company (K) - Matriz Ansoff: Diversificação
Invista em empresas alternativas de proteínas e tecnologia de alimentos à base de plantas
A Kellogg investiu US $ 186 milhões em segmento de alimentos baseado em vegetais em 2022. O Morningstar Incubator Fund recebeu US $ 30 milhões em investimentos diretos da Kellogg. O mercado de carne à base de plantas projetou-se para atingir US $ 27,9 bilhões até 2025.
| Categoria de investimento | Quantia | Ano |
|---|---|---|
| Investimentos alimentares à base de plantas | US $ 186 milhões | 2022 |
| Morningstar Incubator Fund | US $ 30 milhões | 2022 |
Explore aquisições em marcas de alimentos focadas em bem-estar e nutrição
A Kellogg adquiriu a Rxbar por US $ 600 milhões em 2017. A marca Gardein, com sede em plantas, comprou por US $ 103 milhões em 2018.
| Aquisição da marca | Preço de compra | Ano |
|---|---|---|
| Rxbar | US $ 600 milhões | 2017 |
| Gardein | US $ 103 milhões | 2018 |
Desenvolva linhas de produtos de consumo não alimentares em categorias de saúde e bem-estar
A linha de produtos de bem -estar gerou US $ 42 milhões em receita em 2022. O segmento de suplementos de saúde crescendo 7,3% ao ano.
Crie aplicações de rastreamento digital de saúde e nutrição
Orçamento de desenvolvimento de aplicativos de nutrição digital: US $ 15,2 milhões em 2022. A base de usuários cresceu para 340.000 usuários ativos.
Invista em empreendimentos sustentáveis de inovação alimentar e tecnologia agrícola
O investimento em agricultura sustentável atingiu US $ 87 milhões em 2022. A tecnologia agrícola vertical recebeu US $ 23 milhões em investimento direto.
| Investimento de sustentabilidade | Quantia | Ano |
|---|---|---|
| Agricultura Sustentável Total | US $ 87 milhões | 2022 |
| Tecnologia de agricultura vertical | US $ 23 milhões | 2022 |
Kellogg Company (K) - Ansoff Matrix: Market Penetration
You're looking at the immediate challenge of growing sales within your current cereal markets, which is the core of market penetration. The first quarter of 2025 definitely showed the pressure here; organic net sales were down 5.6% year-over-year, landing at $667 million. That decline was largely volume-driven, with tonnage falling by 8.6% in the quarter. Reversing that volume erosion is your top priority for this quadrant.
Here's a quick look at the Q1 2025 financial snapshot that frames the need for aggressive penetration:
| Metric | Q1 2025 Value | Year-over-Year Change |
| Organic Net Sales | $667 million | (5.6)% |
| Volume/Tonnage | N/A | (8.6)% |
| Price/Mix | N/A | 3.0% |
| Adjusted EBITDA Margin | 10.8% | Up 20 basis points |
| US Cereal Category Share | 25.4% | Down 100 basis points |
To combat the volume slide, which is more severe than the implied trailing twelve months decline you mentioned, you need to push harder on the shelf. This means increasing promotional spending, but smartly. The goal isn't just spending more; it's about driving trial and repeat purchases for core offerings. We need to see promotional activity that directly reverses the 8.6% volume drop seen in Q1 2025.
Optimizing pack sizes and price tiers is crucial for capturing value across the board. While you successfully implemented strategic pricing, which resulted in a 3.0% increase in price/mix in Q1 2025, this pricing power needs to be balanced against volume loss. You must ensure that value packs are available for the budget-conscious consumer segment, while premium offerings maintain their margin contribution. This balancing act helps offset the cost inflation that necessitated the initial price hikes.
In-store execution in the U.S. retail channels is where the rubber meets the road for penetration. The data shows the U.S. category share for your core cereal business fell 100 basis points to 25.4%. This suggests competitors are winning on shelf presence or immediate consumer pull. Focus must be laser-sharp on the execution for your leading brands, ensuring prime shelf placement, effective point-of-sale materials, and consistent on-shelf availability. The management team is banking on sequential improvement driven by distribution gains to help turn this around.
Sustaining strategic pricing is a necessary defense, but penetration is an offense. The 3.0% price/mix improvement in Q1 2025 helped the Adjusted EBITDA margin reach 10.8%, which is a positive step, but it can't fully compensate for the volume weakness. The revised 2025 organic net sales guidance is now projected to decline between (2.0)% to (3.0)%, showing the market's reaction to the Q1 results. Therefore, the pricing strategy must be maintained to protect margins while promotional activity aggressively targets volume recovery.
Finally, expanding distribution points within existing networks is a clear action item. Management specifically cited expecting sequential sales improvement driven by distribution gains. This means pushing deeper into existing U.S. grocery and convenience store footprints, especially targeting value channels like dollar stores, as part of the plan to stabilize the top line. This effort is happening alongside significant capital investment, with additions to properties totaling $60 million in Q1 2025, partly funding the infrastructure needed for better reach.
Finance: draft 13-week cash view by Friday.
Kellogg Company (K) - Ansoff Matrix: Market Development
The current structure, Kellanova (K), is focused on global expansion for its core snacking and international cereal portfolio, building upon a footprint that previously marketed products in more than 180 countries.
Accelerate expansion of core snack brands into emerging markets across the 180+ countries served.
- Kellanova (K) reported total net sales of $3.08 Billion for the first quarter of fiscal year 2025.
- Trailing twelve-month (TTM) revenue for Kellanova (K) ending in late 2025 stood at approximately $12.67 Billion USD.
- Organic net sales for Kellanova (K) declined by 5.6% in the first quarter of 2025 year-over-year.
- In the second quarter of 2025, Kellanova (K) reported quarterly sales of $3.203 billion, a slight decrease of 0.3% year-over-year.
Establish new manufacturing and distribution hubs in high-growth regions like Asia and Latin America.
| Region Segment | Metric | Value |
| Kellogg MENAT & SA (Part of AMEA) | Countries where brands are marketed | 65 |
| Kellogg MENAT & SA (Part of AMEA) | Manufacturing facilities | 8 |
| Pre-Split Kellogg Company (as of Feb 2023) | Countries where products were manufactured | 21 |
Tailor international cereal offerings to local tastes in Europe and Australia, where the brand is strong.
- Kellanova (K)'s reported net sales in Europe increased by 2% year-over-year in the second quarter of 2025.
- The company is using improved price/mix to offset volume declines in Europe.
Leverage the existing international cereal infrastructure to introduce Pringles and Cheez-It.
- Kellanova (K) plans to grow the Pringles brand into a $4 billion brand globally.
- The plan included launching Cheez-It in France and Spain during 2025.
- In 2022, the snack division, which includes these brands, accounted for 80% of Kellogg's total sales of $14.2 billion.
Target new institutional channels, like corporate cafeterias and travel retail, with existing products.
- Currently, 24% of Pringles are sold in convenience and smaller store locations, indicating an under-indexed channel opportunity.
Kellogg Company (K) - Ansoff Matrix: Product Development
You're looking at how Kellogg Company (K), now primarily WK Kellogg Co. (KLG) for cereal, is pushing new products to drive growth, which is the essence of the Product Development strategy in the Ansoff Matrix. This is critical, especially since the cereal segment faces headwinds; for instance, WK Kellogg Co. reported organic net sales of $667 million for Q1 2025, with tonnage down 8.6% year-over-year. Management is banking on innovation to reverse this trend, projecting 2025 EBITDA growth between 4% and 6%.
The focus on healthier cereal extensions is clear, targeting evolving consumer needs:
- Launch new Special K protein granola and Kashi line extensions focused on fiber and protein.
- For the K-12 channel, WK Kellogg Co. introduced Kashi Strawberry Banana Loops™, which offers 15g of whole grains and is a good source of fiber. They also launched Kellogg's® Frosted Mini-Wheats® Cocoa, noted as an excellent source of fiber and a good source of 7 vitamins and minerals.
For the snacking brands now under Kellanova, innovation on core drivers remains a priority, often involving line extensions to manage risk:
- Invest in the innovation pipeline to create new flavors for Pringles and Cheez-It, a core growth driver.
- Kellanova has a specific goal to grow the Pringles brand into a $4 billion brand.
- Cheez-It expansion included launching into new international markets like France and Spain in 2025.
Introducing new formats addresses the consumer desire for convenience, a major factor in the broader market shift away from traditional sit-down breakfasts:
Introduce new formats for existing products, such as single-serve, on-the-go snack pouches. Management emphasized the importance of innovation in 2025, specifically including new on-the-go offerings. This aligns with the strategy for salty snacks, where 24% of Pringles were sold in convenience and smaller stores, indicating an under-indexed channel opportunity.
Reformulation is a direct response to health trends, particularly sugar reduction:
Reformulate existing international cereal products to meet growing consumer demand for lower sugar. Consumer concerns about sugar intake are significant, as evidenced by pledges from WK Kellogg Co. and General Mills to phase out artificial dyes. This strategic shift is necessary as U.S. cereal sales have been declining for over 25 years.
The frozen breakfast category represents an area for building on an existing base, though the specific base number of $1.10 Billion wasn't confirmed in the search results. However, the overall market context shows significant growth potential:
Develop new frozen breakfast items to build on the existing frozen and specialty channel base. The broader global frozen breakfast foods market is projected to grow by USD 2.49 billion from 2025 to 2029, progressing at a Compound Annual Growth Rate (CAGR) of over 8% during that period.
Here is a snapshot of the context surrounding these product development efforts, focusing on the most recent financial figures available for the spun-off entity and the related snack business:
| Metric / Brand Focus | Value / Detail | Source Context Year |
| WK Kellogg Co. Projected Organic Net Sales Decline | Between 2.0% and 3.0% | 2025 Full Year |
| WK Kellogg Co. Projected EBITDA Growth | Between 4% and 6% | 2025 Outlook |
| WK Kellogg Co. Q1 2025 Organic Net Sales | $667 million | Q1 2025 |
| Kashi Entry into K-12 Channel | New product launch (Strawberry Banana Loops) | November 2025 |
| Pringles Growth Target | $4 billion brand | Future Goal |
| Cheez-It International Expansion Year | France and Spain launch | 2025 |
| Frozen Breakfast Market Growth (2025-2029) | USD 2.49 billion | Forecast |
You need to track the actual sales contribution from the new Special K and Kashi launches against the projected 2.0% to 3.0% net sales decline for WK Kellogg Co. in 2025. Finance: draft the Q2 2025 innovation ROI tracking dashboard by next Wednesday.
Kellogg Company (K) - Ansoff Matrix: Diversification
You're looking at the next frontier for Kellogg Company, which is now Kellanova, post-spin-off. The core business you are analyzing had Trailing Twelve Month revenue as of late 2025 sitting at approximately $12.67 Billion USD. That's the baseline before we map out these diversification moves.
Acquire a regional, high-growth, plant-based protein brand to complement Morning Star Farms.
You know MorningStar Farms is the anchor for Kellanova in this space, having generated estimated 2021 net sales of $340 Million. The broader plant-based food market is projected to grow at a compound annual growth rate of 12% through 2028, reaching a total size of $79 Billion. If you acquire a regional player, you're aiming to capture a piece of that growth, especially since the segment has shown long-term potential, even if MorningStar Farms represented only about 2% of the old Kellogg's total sales. Here's the quick math on the potential scale of the category you are entering:
| Metric | Value |
|---|---|
| Plant-Based Food Market Projected Size (2028) | $79 Billion |
| Plant-Based Food Market CAGR (through 2028) | 12% |
| MorningStar Farms Estimated 2021 Net Sales | $340 Million |
Enter the ready-to-drink (RTD) beverage market with a fortified, cereal-milk-based product line.
This is a jump into a massive, convenience-driven category. The Europe Ready-to-Drink beverages market size is estimated at USD 156.76 Billion in 2025. Your specific focus on fortified, meal-replacement shakes aligns with the fastest-growing sub-segment; protein and meal-replacement shakes lead with a 7.32% compound annual growth rate through 2030. To be fair, Kellanova's Q1 2025 North America net sales were $1.62 Billion, so an RTD line would need significant scale to move the needle quickly, but the category's overall size is compelling.
- Europe RTD Beverage Market Size (2025 Estimate): USD 156.76 Billion
- Fastest Growing RTD Segment CAGR (Protein/Meal-Replacement): 7.32% (through 2030)
- Kellanova North America Q1 2025 Net Sales: $1.62 Billion
Pursue inorganic growth (M&A) to broaden the portfolio beyond snacks and cereal into adjacent categories.
You've seen the appetite for large transactions, even if it was with the spun-off entity. The July 10, 2025, agreement for Ferrero to acquire WK Kellogg Co was valued at a $3.1 Billion cash deal. That transaction gives you a benchmark for the capital required to execute a major portfolio shift. Kellanova's 2024 revenue was $12.74 Billion, so any M&A would need to be substantial to meaningfully shift the revenue mix away from the core snacking engine.
- WK Kellogg Co Acquisition Price (July 2025): $3.1 Billion
- Kellanova 2024 Total Revenue: $12.74 Billion
- Kellanova AMEA Q1 2025 Net Sales: $620 Million
Establish a direct-to-consumer (DTC) subscription service for niche, premium, health-focused food boxes.
The DTC food space is definitely growing, and a niche subscription box plays right into the personalization trend. The Direct-to-Consumer Food Market Size was estimated at $13.8 Billion in 2024, and it is projected to grow from $15.02 Billion in 2025 to $35.08 Billion by 2035, showing an 8.85% compound annual growth rate. The global food subscription market specifically is estimated at USD 6.11 Bn in 2025. If onboarding takes 14+ days, churn risk rises, so execution speed matters here.
| DTC Food Metric (2025) | Value |
|---|---|
| Estimated DTC Food Market Size | $15.02 Billion USD |
| Global Food Subscription Market Estimated Value | USD 6.11 Bn |
| DTC Food Market Projected CAGR (2025-2035) | 8.85% |
Launch a new line of functional food supplements in a new geographic region like Western Europe.
Moving into functional supplements in Western Europe targets a health-aware consumer base. The Western Europe dietary supplements market is poised to exhibit USD 19 billion in 2025. This market is slated to depict an 8.7% compound annual growth rate from 2025 to 2035, reaching USD 42.9 billion. Vitamins and minerals currently hold the largest market share in Europe, at approximately 40% in 2024.
- Western Europe Dietary Supplements Market Size (2025 Estimate): USD 19 billion
- Western Europe Dietary Supplements Market Projected CAGR (2025-2035): 8.7%
- Europe Vitamins Segment Market Share (2024): Approximately 40%
Finance: draft 13-week cash view by Friday.
Disclaimer
All information, articles, and product details provided on this website are for general informational and educational purposes only. We do not claim any ownership over, nor do we intend to infringe upon, any trademarks, copyrights, logos, brand names, or other intellectual property mentioned or depicted on this site. Such intellectual property remains the property of its respective owners, and any references here are made solely for identification or informational purposes, without implying any affiliation, endorsement, or partnership.
We make no representations or warranties, express or implied, regarding the accuracy, completeness, or suitability of any content or products presented. Nothing on this website should be construed as legal, tax, investment, financial, medical, or other professional advice. In addition, no part of this site—including articles or product references—constitutes a solicitation, recommendation, endorsement, advertisement, or offer to buy or sell any securities, franchises, or other financial instruments, particularly in jurisdictions where such activity would be unlawful.
All content is of a general nature and may not address the specific circumstances of any individual or entity. It is not a substitute for professional advice or services. Any actions you take based on the information provided here are strictly at your own risk. You accept full responsibility for any decisions or outcomes arising from your use of this website and agree to release us from any liability in connection with your use of, or reliance upon, the content or products found herein.