
|
Kalyan Jewellers India Limited (Kalyankjil.NS) Avaliação DCF |
Totalmente Editável: Adapte-Se Às Suas Necessidades No Excel Ou Planilhas
Design Profissional: Modelos Confiáveis E Padrão Da Indústria
Pré-Construídos Para Uso Rápido E Eficiente
Compatível com MAC/PC, totalmente desbloqueado
Não É Necessária Experiência; Fácil De Seguir
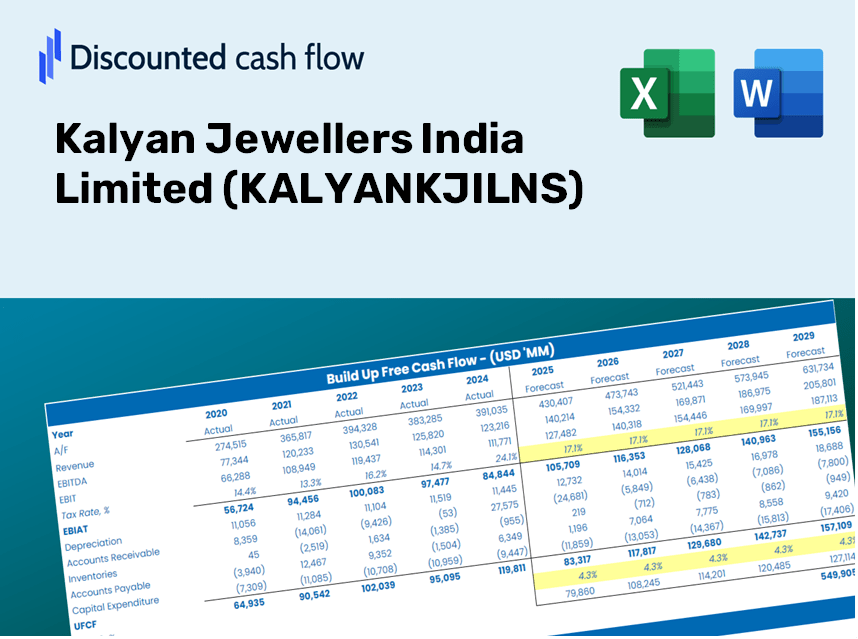
Kalyan Jewellers India Limited (KALYANKJIL.NS) Bundle
Avalie as perspectivas financeiras da Kalyan Jewellers India Limited como um especialista! Esta calculadora (Kalyankjilns) DCF fornece dados financeiros pré-populados, juntamente com a flexibilidade de modificar o crescimento da receita, o WACC, as margens e outras suposições críticas para se alinhar às suas previsões.
Discounted Cash Flow (DCF) - (USD MM)
| Year | AY1 2021 |
AY2 2022 |
AY3 2023 |
AY4 2024 |
AY5 2025 |
FY1 2026 |
FY2 2027 |
FY3 2028 |
FY4 2029 |
FY5 2030 |
|---|---|---|---|---|---|---|---|---|---|---|
| Revenue | 85,433.4 | 107,808.3 | 140,250.1 | 185,155.5 | 250,450.7 | 327,818.1 | 429,085.4 | 561,635.4 | 735,131.9 | 962,223.7 |
| Revenue Growth, % | 0 | 26.19 | 30.09 | 32.02 | 35.27 | 30.89 | 30.89 | 30.89 | 30.89 | 30.89 |
| EBITDA | 6,258.8 | 8,336.9 | 11,026.8 | 14,417.2 | 16,617.8 | 24,483.4 | 32,046.7 | 41,946.3 | 54,904.1 | 71,864.6 |
| EBITDA, % | 7.33 | 7.73 | 7.86 | 7.79 | 6.64 | 7.47 | 7.47 | 7.47 | 7.47 | 7.47 |
| Depreciation | 2,249.0 | 2,315.8 | 2,445.8 | 2,743.0 | 3,427.2 | 6,146.1 | 8,044.8 | 10,529.9 | 13,782.7 | 18,040.4 |
| Depreciation, % | 2.63 | 2.15 | 1.74 | 1.48 | 1.37 | 1.87 | 1.87 | 1.87 | 1.87 | 1.87 |
| EBIT | 4,009.8 | 6,021.1 | 8,580.9 | 11,674.2 | 13,190.6 | 18,337.3 | 24,001.9 | 31,416.4 | 41,121.3 | 53,824.2 |
| EBIT, % | 4.69 | 5.59 | 6.12 | 6.31 | 5.27 | 5.59 | 5.59 | 5.59 | 5.59 | 5.59 |
| Total Cash | 3,648.6 | 1,490.2 | 1,409.1 | 1,777.1 | 12,012.6 | 8,138.9 | 10,653.1 | 13,944.0 | 18,251.5 | 23,889.7 |
| Total Cash, percent | .0 | .0 | .0 | .0 | .0 | .0 | .0 | .0 | .0 | .0 |
| Account Receivables | 1,135.0 | 1,212.9 | 2,614.5 | 3,697.1 | 3,999.2 | 5,187.0 | 6,789.3 | 8,886.6 | 11,631.8 | 15,225.0 |
| Account Receivables, % | 1.33 | 1.13 | 1.86 | 2 | 1.6 | 1.58 | 1.58 | 1.58 | 1.58 | 1.58 |
| Inventories | 53,030.9 | 57,942.6 | 70,138.8 | 82,975.7 | 96,811.1 | 163,448.4 | 213,939.7 | 280,028.5 | 366,532.9 | 479,759.7 |
| Inventories, % | 62.07 | 53.75 | 50.01 | 44.81 | 38.65 | 49.86 | 49.86 | 49.86 | 49.86 | 49.86 |
| Accounts Payable | 6,901.1 | 6,565.9 | 11,926.9 | 19,441.5 | 23,503.1 | 27,901.6 | 36,520.7 | 47,802.4 | 62,569.2 | 81,897.7 |
| Accounts Payable, % | 8.08 | 6.09 | 8.5 | 10.5 | 9.38 | 8.51 | 8.51 | 8.51 | 8.51 | 8.51 |
| Capital Expenditure | -481.6 | -912.6 | -1,871.2 | -3,714.5 | -4,648.3 | -4,331.5 | -5,669.5 | -7,420.9 | -9,713.3 | -12,713.9 |
| Capital Expenditure, % | -0.56373 | -0.84653 | -1.33 | -2.01 | -1.86 | -1.32 | -1.32 | -1.32 | -1.32 | -1.32 |
| Tax Rate, % | 25.51 | 25.51 | 25.51 | 25.51 | 25.51 | 25.51 | 25.51 | 25.51 | 25.51 | 25.51 |
| EBITAT | -642.3 | 4,517.2 | 6,502.7 | 8,840.4 | 9,825.6 | 11,039.7 | 14,450.0 | 18,913.8 | 24,756.6 | 32,404.2 |
| Depreciation | ||||||||||
| Changes in Account Receivables | ||||||||||
| Changes in Inventories | ||||||||||
| Changes in Accounts Payable | ||||||||||
| Capital Expenditure | ||||||||||
| UFCF | -46,139.7 | 595.6 | -1,159.4 | 1,463.9 | -1,471.3 | -50,572.1 | -26,649.2 | -34,881.5 | -45,656.8 | -59,760.8 |
| WACC, % | 4.25 | 4.72 | 4.73 | 4.73 | 4.72 | 4.63 | 4.63 | 4.63 | 4.63 | 4.63 |
| PV UFCF | ||||||||||
| SUM PV UFCF | -188,889.4 | |||||||||
| Long Term Growth Rate, % | 4.00 | |||||||||
| Free cash flow (T + 1) | -62,151 | |||||||||
| Terminal Value | -9,880,815 | |||||||||
| Present Terminal Value | -7,880,108 | |||||||||
| Enterprise Value | -8,068,998 | |||||||||
| Net Debt | 45,890 | |||||||||
| Equity Value | -8,114,888 | |||||||||
| Diluted Shares Outstanding, MM | 1,032 | |||||||||
| Equity Value Per Share | -7,864.55 |
What You'll Receive
- Customizable Excel Template: A fully editable Excel-based DCF Calculator featuring pre-loaded financial data for Kalyan Jewellers India Limited (KALYANKJILNS).
- Authentic Data: Access to historical data along with forward-looking estimates as indicated in the highlighted cells.
- Flexible Forecasting: Adjust key assumptions such as revenue growth, EBITDA percentage, and WACC.
- Instant Calculations: Quickly visualize how your inputs affect the valuation of Kalyan Jewellers India Limited (KALYANKJILNS).
- Professional Resource: Designed for investors, CFOs, consultants, and financial analysts.
- User-Friendly Layout: Organized for simplicity and ease of navigation, complete with step-by-step guidance.
Key Features
- 🔍 Real-Life KALYANKJILNS Financials: Pre-populated historical and projected financial data for Kalyan Jewellers India Limited.
- ✏️ Fully Customizable Inputs: Modify all essential parameters (yellow cells) such as WACC, growth %, and tax rates.
- 📊 Professional DCF Valuation: Integrated formulas compute Kalyan Jewellers' intrinsic value using the Discounted Cash Flow method.
- ⚡ Instant Results: View Kalyan Jewellers' valuation immediately after adjustments.
- Scenario Analysis: Evaluate and compare different financial assumptions side-by-side.
How It Functions
- Step 1: Download the Excel spreadsheet.
- Step 2: Examine the pre-filled data for Kalyan Jewellers (KALYANKJILNS) including historical and projected figures.
- Step 3: Modify key assumptions in the highlighted yellow cells according to your insights.
- Step 4: Observe the automatic recalculations for Kalyan Jewellers’ intrinsic value.
- Step 5: Utilize the results for investment decisions or reporting purposes.
Why Opt for Kalyan Jewellers' Calculator?
- Save Time: Skip the hassle of building a model from the ground up – it's ready for you.
- Enhance Accuracy: Dependable financial data and formulas minimize valuation errors.
- Completely Customizable: Adjust the model to align with your assumptions and forecasts.
- User-Friendly: Intuitive charts and outputs facilitate straightforward analysis of results.
- Endorsed by Professionals: Crafted for those who prioritize precision and efficiency.
Who Can Benefit from This Product?
- Investors: Gain precise insights into Kalyan Jewellers' fair value before making investment choices.
- CFOs: Utilize a top-tier DCF model for comprehensive financial reporting and analysis.
- Consultants: Easily customize the template for client valuation reports.
- Entrepreneurs: Discover financial modeling techniques employed by leading jewelry firms.
- Educators: Implement it as a teaching resource to illustrate valuation methods.
What the Template Includes
- Operating and Balance Sheet Data: Pre-populated historical data and forecasts for Kalyan Jewellers India Limited (KALYANKJILNS), covering revenue, EBITDA, EBIT, and capital expenditures.
- WACC Calculation: A specific sheet for calculating the Weighted Average Cost of Capital (WACC), featuring parameters such as Beta, risk-free rate, and share price.
- DCF Valuation (Unlevered and Levered): Editable Discounted Cash Flow models that illustrate intrinsic value with comprehensive calculations.
- Financial Statements: Pre-loaded financial statements (annual and quarterly) to facilitate thorough analysis.
- Key Ratios: Contains profitability, leverage, and efficiency ratios relevant to Kalyan Jewellers India Limited (KALYANKJILNS).
- Dashboard and Charts: A visual overview of valuation outputs and assumptions, making it easy to analyze results.
Disclaimer
All information, articles, and product details provided on this website are for general informational and educational purposes only. We do not claim any ownership over, nor do we intend to infringe upon, any trademarks, copyrights, logos, brand names, or other intellectual property mentioned or depicted on this site. Such intellectual property remains the property of its respective owners, and any references here are made solely for identification or informational purposes, without implying any affiliation, endorsement, or partnership.
We make no representations or warranties, express or implied, regarding the accuracy, completeness, or suitability of any content or products presented. Nothing on this website should be construed as legal, tax, investment, financial, medical, or other professional advice. In addition, no part of this site—including articles or product references—constitutes a solicitation, recommendation, endorsement, advertisement, or offer to buy or sell any securities, franchises, or other financial instruments, particularly in jurisdictions where such activity would be unlawful.
All content is of a general nature and may not address the specific circumstances of any individual or entity. It is not a substitute for professional advice or services. Any actions you take based on the information provided here are strictly at your own risk. You accept full responsibility for any decisions or outcomes arising from your use of this website and agree to release us from any liability in connection with your use of, or reliance upon, the content or products found herein.