
|
Kimball Electronics, Inc. (KE) Avaliação DCF |
Totalmente Editável: Adapte-Se Às Suas Necessidades No Excel Ou Planilhas
Design Profissional: Modelos Confiáveis E Padrão Da Indústria
Pré-Construídos Para Uso Rápido E Eficiente
Compatível com MAC/PC, totalmente desbloqueado
Não É Necessária Experiência; Fácil De Seguir
Kimball Electronics, Inc. (KE) Bundle
Projetado para precisão, a Calculadora DCF da Kimball Electronics, Inc. (KE) permite avaliar a avaliação da Kimball Electronics usando dados financeiros do mundo real e oferece flexibilidade completa para modificar todos os parâmetros essenciais para obter previsões aprimoradas.
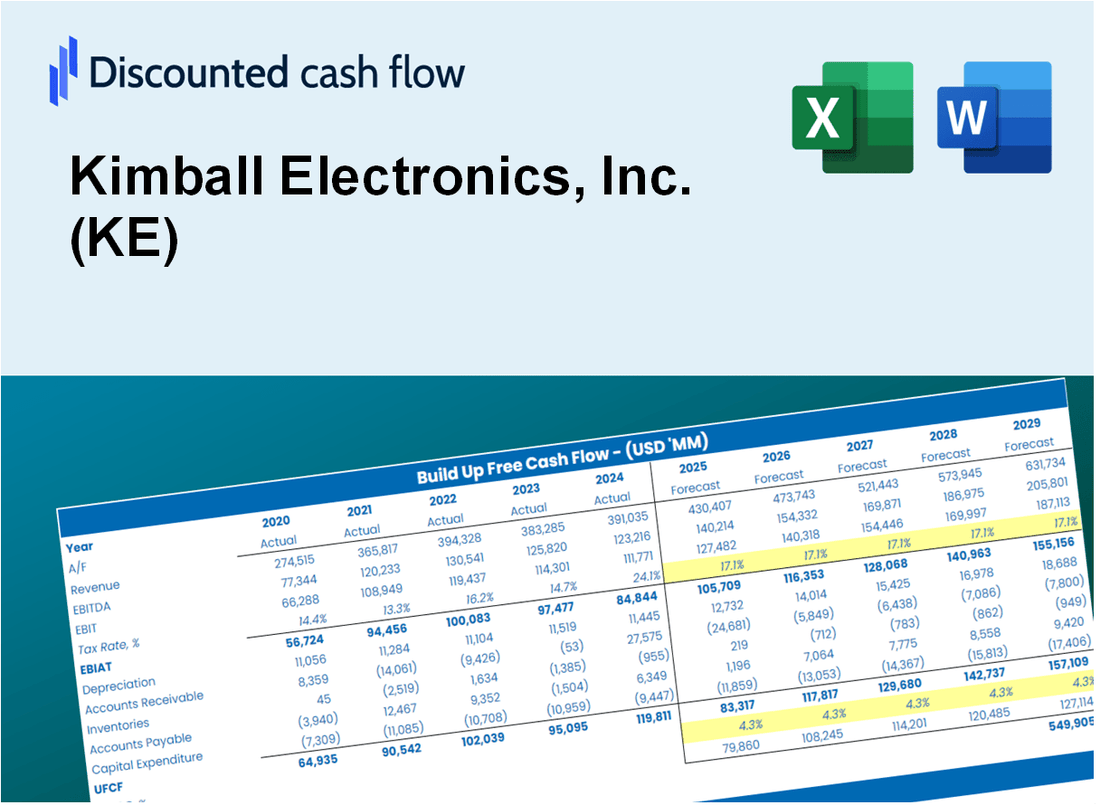
Discounted Cash Flow (DCF) - (USD MM)
| Year | AY1 2021 |
AY2 2022 |
AY3 2023 |
AY4 2024 |
AY5 2025 |
FY1 2026 |
FY2 2027 |
FY3 2028 |
FY4 2029 |
FY5 2030 |
|---|---|---|---|---|---|---|---|---|---|---|
| Revenue | 1,291.8 | 1,349.5 | 1,823.4 | 1,714.5 | 1,486.7 | 1,562.3 | 1,641.7 | 1,725.1 | 1,812.7 | 1,904.8 |
| Revenue Growth, % | 0 | 4.47 | 35.12 | -5.97 | -13.29 | 5.08 | 5.08 | 5.08 | 5.08 | 5.08 |
| EBITDA | 106.2 | 75.8 | 123.4 | 86.1 | 78.0 | 96.5 | 101.4 | 106.5 | 111.9 | 117.6 |
| EBITDA, % | 8.22 | 5.62 | 6.77 | 5.02 | 5.24 | 6.17 | 6.17 | 6.17 | 6.17 | 6.17 |
| Depreciation | 34.0 | 29.4 | 32.4 | 38.0 | 37.0 | 35.3 | 37.1 | 39.0 | 41.0 | 43.0 |
| Depreciation, % | 2.63 | 2.18 | 1.78 | 2.22 | 2.49 | 2.26 | 2.26 | 2.26 | 2.26 | 2.26 |
| EBIT | 72.2 | 46.4 | 91.0 | 48.0 | 41.0 | 61.2 | 64.3 | 67.5 | 71.0 | 74.6 |
| EBIT, % | 5.59 | 3.44 | 4.99 | 2.8 | 2.76 | 3.92 | 3.92 | 3.92 | 3.92 | 3.92 |
| Total Cash | 106.4 | 49.9 | 43.0 | 78.0 | 88.8 | 77.5 | 81.5 | 85.6 | 89.9 | 94.5 |
| Total Cash, percent | .0 | .0 | .0 | .0 | .0 | .0 | .0 | .0 | .0 | .0 |
| Account Receivables | 249.2 | 286.9 | 387.0 | 358.7 | 294.4 | 320.3 | 336.5 | 353.6 | 371.6 | 390.5 |
| Account Receivables, % | 19.29 | 21.26 | 21.22 | 20.92 | 19.8 | 20.5 | 20.5 | 20.5 | 20.5 | 20.5 |
| Inventories | 200.4 | 395.6 | 450.3 | 338.1 | 273.5 | 336.3 | 353.4 | 371.4 | 390.2 | 410.1 |
| Inventories, % | 15.51 | 29.32 | 24.7 | 19.72 | 18.4 | 21.53 | 21.53 | 21.53 | 21.53 | 21.53 |
| Accounts Payable | 216.5 | 300.2 | 322.3 | 213.6 | 218.8 | 262.0 | 275.3 | 289.3 | 304.0 | 319.5 |
| Accounts Payable, % | 16.76 | 22.25 | 17.67 | 12.46 | 14.72 | 16.77 | 16.77 | 16.77 | 16.77 | 16.77 |
| Capital Expenditure | -39.4 | -74.7 | -89.4 | -46.1 | -33.3 | -57.5 | -60.4 | -63.5 | -66.7 | -70.1 |
| Capital Expenditure, % | -3.05 | -5.54 | -4.9 | -2.69 | -2.24 | -3.68 | -3.68 | -3.68 | -3.68 | -3.68 |
| Tax Rate, % | 35.25 | 35.25 | 35.25 | 35.25 | 35.25 | 35.25 | 35.25 | 35.25 | 35.25 | 35.25 |
| EBITAT | 58.5 | 33.2 | 68.0 | 39.1 | 26.5 | 45.7 | 48.0 | 50.4 | 53.0 | 55.7 |
| Depreciation | ||||||||||
| Changes in Account Receivables | ||||||||||
| Changes in Inventories | ||||||||||
| Changes in Accounts Payable | ||||||||||
| Capital Expenditure | ||||||||||
| UFCF | -179.9 | -161.4 | -121.6 | 62.8 | 164.3 | -22.0 | 4.6 | 4.8 | 5.1 | 5.3 |
| WACC, % | 8.97 | 8.8 | 8.86 | 8.98 | 8.69 | 8.86 | 8.86 | 8.86 | 8.86 | 8.86 |
| PV UFCF | ||||||||||
| SUM PV UFCF | -5.5 | |||||||||
| Long Term Growth Rate, % | 3.50 | |||||||||
| Free cash flow (T + 1) | 6 | |||||||||
| Terminal Value | 103 | |||||||||
| Present Terminal Value | 67 | |||||||||
| Enterprise Value | 62 | |||||||||
| Net Debt | 58 | |||||||||
| Equity Value | 4 | |||||||||
| Diluted Shares Outstanding, MM | 25 | |||||||||
| Equity Value Per Share | 0.14 |
What You Will Get
- Real KE Financial Data: Pre-filled with Kimball Electronics’ historical and projected data for precise analysis.
- Fully Editable Template: Modify key inputs like revenue growth, WACC, and EBITDA % with ease.
- Automatic Calculations: See Kimball Electronics’ intrinsic value update instantly based on your changes.
- Professional Valuation Tool: Designed for investors, analysts, and consultants seeking accurate DCF results.
- User-Friendly Design: Simple structure and clear instructions for all experience levels.
Key Features
- Real-Life KE Data: Pre-filled with Kimball Electronics’ historical financials and forward-looking projections.
- Fully Customizable Inputs: Adjust revenue growth, margins, WACC, tax rates, and capital expenditures.
- Dynamic Valuation Model: Automatic updates to Net Present Value (NPV) and intrinsic value based on your inputs.
- Scenario Testing: Create multiple forecast scenarios to analyze different valuation outcomes.
- User-Friendly Design: Simple, structured, and designed for professionals and beginners alike.
How It Works
- Step 1: Download the Excel file.
- Step 2: Review pre-entered Kimball Electronics, Inc. (KE) data (historical and projected).
- Step 3: Adjust key assumptions (yellow cells) based on your analysis.
- Step 4: View automatic recalculations for Kimball Electronics, Inc. (KE)’s intrinsic value.
- Step 5: Use the outputs for investment decisions or reporting.
Why Choose Kimball Electronics, Inc. (KE)?
- Innovative Solutions: Cutting-edge technology enhances product performance and reliability.
- Global Reach: Extensive network ensures timely delivery and support across various markets.
- Quality Assurance: Rigorous testing and quality control processes guarantee superior products.
- Customer-Centric Approach: Tailored services and support to meet unique client needs.
- Industry Expertise: A dedicated team with deep knowledge and experience in electronics manufacturing.
Who Should Use This Product?
- Investors: Evaluate Kimball Electronics, Inc.'s (KE) market position before making investment decisions.
- CFOs and Financial Analysts: Optimize valuation methodologies and assess financial forecasts for Kimball Electronics, Inc. (KE).
- Startup Founders: Understand the valuation strategies of established companies like Kimball Electronics, Inc. (KE).
- Consultants: Provide comprehensive valuation analyses and reports for clients regarding Kimball Electronics, Inc. (KE).
- Students and Educators: Utilize data from Kimball Electronics, Inc. (KE) to enhance learning and teaching of valuation practices.
What the Template Contains
- Operating and Balance Sheet Data: Pre-filled Kimball Electronics historical data and forecasts, including revenue, EBITDA, EBIT, and capital expenditures.
- WACC Calculation: A dedicated sheet for Weighted Average Cost of Capital (WACC), incorporating parameters like Beta, risk-free rate, and share price.
- DCF Valuation (Unlevered and Levered): Editable Discounted Cash Flow models presenting intrinsic value with comprehensive calculations.
- Financial Statements: Pre-loaded financial statements (annual and quarterly) to facilitate analysis.
- Key Ratios: Includes profitability, leverage, and efficiency ratios for Kimball Electronics, Inc. (KE).
- Dashboard and Charts: Visual summary of valuation outputs and assumptions for easy result analysis.
Disclaimer
All information, articles, and product details provided on this website are for general informational and educational purposes only. We do not claim any ownership over, nor do we intend to infringe upon, any trademarks, copyrights, logos, brand names, or other intellectual property mentioned or depicted on this site. Such intellectual property remains the property of its respective owners, and any references here are made solely for identification or informational purposes, without implying any affiliation, endorsement, or partnership.
We make no representations or warranties, express or implied, regarding the accuracy, completeness, or suitability of any content or products presented. Nothing on this website should be construed as legal, tax, investment, financial, medical, or other professional advice. In addition, no part of this site—including articles or product references—constitutes a solicitation, recommendation, endorsement, advertisement, or offer to buy or sell any securities, franchises, or other financial instruments, particularly in jurisdictions where such activity would be unlawful.
All content is of a general nature and may not address the specific circumstances of any individual or entity. It is not a substitute for professional advice or services. Any actions you take based on the information provided here are strictly at your own risk. You accept full responsibility for any decisions or outcomes arising from your use of this website and agree to release us from any liability in connection with your use of, or reliance upon, the content or products found herein.