
|
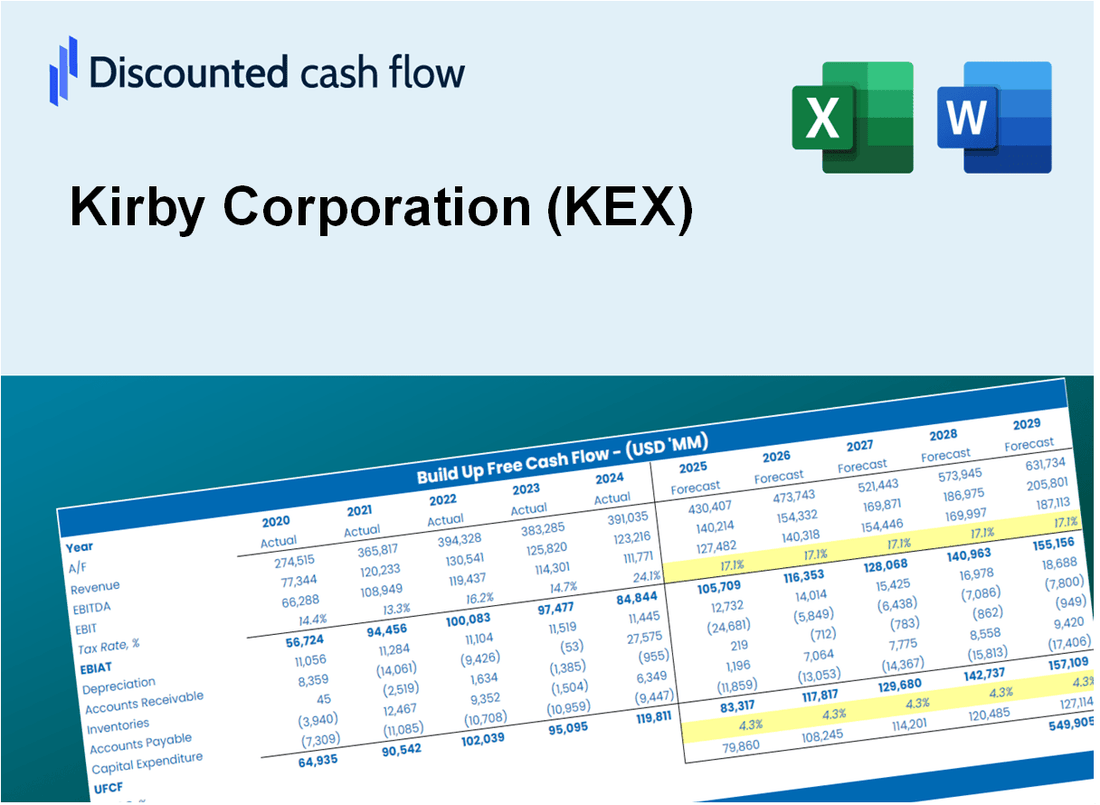
Avaliação DCF da Kirby Corporation (KEX) |
Totalmente Editável: Adapte-Se Às Suas Necessidades No Excel Ou Planilhas
Design Profissional: Modelos Confiáveis E Padrão Da Indústria
Pré-Construídos Para Uso Rápido E Eficiente
Compatível com MAC/PC, totalmente desbloqueado
Não É Necessária Experiência; Fácil De Seguir
Kirby Corporation (KEX) Bundle
Avalie as perspectivas financeiras da Kirby Corporation (KEX) como um especialista! Essa calculadora DCF (KEX) vem com finanças pré-carregadas e oferece total flexibilidade para modificar o crescimento da receita, WACC, margens e outras suposições essenciais para se alinhar às suas projeções.
Discounted Cash Flow (DCF) - (USD MM)
| Year | AY1 2020 |
AY2 2021 |
AY3 2022 |
AY4 2023 |
AY5 2024 |
FY1 2025 |
FY2 2026 |
FY3 2027 |
FY4 2028 |
FY5 2029 |
|---|---|---|---|---|---|---|---|---|---|---|
| Revenue | 2,171.4 | 2,246.7 | 2,784.8 | 3,091.6 | 3,265.9 | 3,625.7 | 4,025.2 | 4,468.7 | 4,961.1 | 5,507.7 |
| Revenue Growth, % | 0 | 3.47 | 23.95 | 11.02 | 5.64 | 11.02 | 11.02 | 11.02 | 11.02 | 11.02 |
| EBITDA | -192.7 | -34.4 | 411.0 | 557.3 | 652.2 | 307.1 | 340.9 | 378.5 | 420.2 | 466.5 |
| EBITDA, % | -8.87 | -1.53 | 14.76 | 18.03 | 19.97 | 8.47 | 8.47 | 8.47 | 8.47 | 8.47 |
| Depreciation | 219.9 | 213.7 | 201.4 | 211.2 | 240.3 | 297.8 | 330.6 | 367.0 | 407.4 | 452.3 |
| Depreciation, % | 10.13 | 9.51 | 7.23 | 6.83 | 7.36 | 8.21 | 8.21 | 8.21 | 8.21 | 8.21 |
| EBIT | -412.6 | -248.1 | 209.6 | 346.1 | 411.9 | 9.3 | 10.4 | 11.5 | 12.8 | 14.2 |
| EBIT, % | -19 | -11.04 | 7.53 | 11.2 | 12.61 | 0.25732 | 0.25732 | 0.25732 | 0.25732 | 0.25732 |
| Total Cash | 80.3 | 34.8 | 80.6 | 32.6 | 74.4 | 83.2 | 92.4 | 102.6 | 113.9 | 126.4 |
| Total Cash, percent | .0 | .0 | .0 | .0 | .0 | .0 | .0 | .0 | .0 | .0 |
| Account Receivables | 600.2 | 567.9 | 598.0 | 578.7 | 536.7 | 794.4 | 881.9 | 979.0 | 1,086.9 | 1,206.7 |
| Account Receivables, % | 27.64 | 25.28 | 21.47 | 18.72 | 16.43 | 21.91 | 21.91 | 21.91 | 21.91 | 21.91 |
| Inventories | 309.7 | 331.4 | 461.8 | 454.4 | 393.9 | 524.7 | 582.5 | 646.6 | 717.9 | 797.0 |
| Inventories, % | 14.26 | 14.75 | 16.58 | 14.7 | 12.06 | 14.47 | 14.47 | 14.47 | 14.47 | 14.47 |
| Accounts Payable | 162.5 | 199.1 | 278.1 | 269.4 | 251.4 | 309.9 | 344.1 | 382.0 | 424.1 | 470.8 |
| Accounts Payable, % | 7.48 | 8.86 | 9.99 | 8.71 | 7.7 | 8.55 | 8.55 | 8.55 | 8.55 | 8.55 |
| Capital Expenditure | -148.2 | -98.0 | -172.6 | -401.7 | -342.7 | -296.4 | -329.0 | -365.3 | -405.5 | -450.2 |
| Capital Expenditure, % | -6.82 | -4.36 | -6.2 | -12.99 | -10.49 | -8.17 | -8.17 | -8.17 | -8.17 | -8.17 |
| Tax Rate, % | 20.97 | 20.97 | 20.97 | 20.97 | 20.97 | 20.97 | 20.97 | 20.97 | 20.97 | 20.97 |
| EBITAT | -243.8 | -210.9 | 155.3 | 262.4 | 325.5 | 7.0 | 7.7 | 8.6 | 9.5 | 10.6 |
| Depreciation | ||||||||||
| Changes in Account Receivables | ||||||||||
| Changes in Inventories | ||||||||||
| Changes in Accounts Payable | ||||||||||
| Capital Expenditure | ||||||||||
| UFCF | -919.4 | -48.0 | 102.6 | 89.8 | 307.6 | -321.5 | -101.9 | -113.1 | -125.6 | -139.4 |
| WACC, % | 7.6 | 7.78 | 7.71 | 7.72 | 7.74 | 7.71 | 7.71 | 7.71 | 7.71 | 7.71 |
| PV UFCF | ||||||||||
| SUM PV UFCF | -666.4 | |||||||||
| Long Term Growth Rate, % | 3.00 | |||||||||
| Free cash flow (T + 1) | -144 | |||||||||
| Terminal Value | -3,050 | |||||||||
| Present Terminal Value | -2,104 | |||||||||
| Enterprise Value | -2,771 | |||||||||
| Net Debt | 984 | |||||||||
| Equity Value | -3,755 | |||||||||
| Diluted Shares Outstanding, MM | 58 | |||||||||
| Equity Value Per Share | -64.35 |
What You Will Receive
- Customizable Excel Template: A fully adjustable Excel-based DCF Calculator featuring pre-filled real KEX financials.
- Authentic Data: Historical data and forward-looking projections (highlighted in the yellow cells).
- Assumption Flexibility: Modify forecast parameters such as revenue growth, EBITDA %, and WACC.
- Instant Calculations: Quickly observe the effects of your inputs on Kirby Corporation’s valuation.
- Professional Resource: Designed for investors, CFOs, consultants, and financial analysts.
- User-Friendly Layout: Organized for clarity and ease of use, complete with step-by-step guidance.
Key Features
- Comprehensive DCF Calculator: Features detailed unlevered and levered DCF valuation models tailored for Kirby Corporation (KEX).
- WACC Calculator: Ready-to-use Weighted Average Cost of Capital sheet with adjustable inputs specific to Kirby Corporation (KEX).
- Customizable Forecast Assumptions: Adjust growth rates, capital expenditures, and discount rates to fit your analysis of Kirby Corporation (KEX).
- Integrated Financial Ratios: Evaluate profitability, leverage, and efficiency ratios relevant to Kirby Corporation (KEX).
- Interactive Dashboard and Charts: Visual representations summarize essential valuation metrics for straightforward analysis of Kirby Corporation (KEX).
How It Works
- Download the Template: Gain immediate access to the Excel-based KEX DCF Calculator.
- Input Your Assumptions: Modify the yellow-highlighted cells for growth rates, WACC, margins, and additional parameters.
- Instant Calculations: The model automatically recalculates Kirby Corporation’s intrinsic value.
- Test Scenarios: Experiment with various assumptions to assess potential changes in valuation.
- Analyze and Decide: Utilize the outcomes to inform your investment or financial assessment.
Why Choose This Calculator for Kirby Corporation (KEX)?
- All-in-One Solution: Combines DCF, WACC, and financial ratio analyses tailored for Kirby Corporation (KEX).
- Flexible Inputs: Modify the yellow-highlighted fields to explore different financial scenarios.
- In-Depth Analysis: Automatically computes the intrinsic value and Net Present Value for Kirby Corporation (KEX).
- Preloaded Information: Access historical and projected data for accurate financial assessments.
- High-Quality Standards: Perfect for financial analysts, investors, and business consultants focusing on Kirby Corporation (KEX).
Who Should Use This Product?
- Professional Investors: Develop comprehensive and accurate valuation models for portfolio assessment of Kirby Corporation (KEX).
- Corporate Finance Teams: Evaluate valuation scenarios to inform strategic decisions within the organization.
- Consultants and Advisors: Deliver precise valuation insights to clients regarding Kirby Corporation (KEX) stock.
- Students and Educators: Utilize real-time data to practice and teach financial modeling techniques.
- Industry Analysts: Gain insights into how companies like Kirby Corporation (KEX) are valued in the marketplace.
What the Template Contains
- Pre-Filled DCF Model: Kirby Corporation’s (KEX) financial data preloaded for immediate use.
- WACC Calculator: Detailed calculations for Weighted Average Cost of Capital.
- Financial Ratios: Evaluate Kirby Corporation’s (KEX) profitability, leverage, and efficiency.
- Editable Inputs: Change assumptions such as growth, margins, and CAPEX to fit your scenarios.
- Financial Statements: Annual and quarterly reports to support detailed analysis.
- Interactive Dashboard: Easily visualize key valuation metrics and results.
Disclaimer
All information, articles, and product details provided on this website are for general informational and educational purposes only. We do not claim any ownership over, nor do we intend to infringe upon, any trademarks, copyrights, logos, brand names, or other intellectual property mentioned or depicted on this site. Such intellectual property remains the property of its respective owners, and any references here are made solely for identification or informational purposes, without implying any affiliation, endorsement, or partnership.
We make no representations or warranties, express or implied, regarding the accuracy, completeness, or suitability of any content or products presented. Nothing on this website should be construed as legal, tax, investment, financial, medical, or other professional advice. In addition, no part of this site—including articles or product references—constitutes a solicitation, recommendation, endorsement, advertisement, or offer to buy or sell any securities, franchises, or other financial instruments, particularly in jurisdictions where such activity would be unlawful.
All content is of a general nature and may not address the specific circumstances of any individual or entity. It is not a substitute for professional advice or services. Any actions you take based on the information provided here are strictly at your own risk. You accept full responsibility for any decisions or outcomes arising from your use of this website and agree to release us from any liability in connection with your use of, or reliance upon, the content or products found herein.