
|
KIER GRUPO PLC (KIE.L) Avaliação DCF |
Totalmente Editável: Adapte-Se Às Suas Necessidades No Excel Ou Planilhas
Design Profissional: Modelos Confiáveis E Padrão Da Indústria
Pré-Construídos Para Uso Rápido E Eficiente
Compatível com MAC/PC, totalmente desbloqueado
Não É Necessária Experiência; Fácil De Seguir
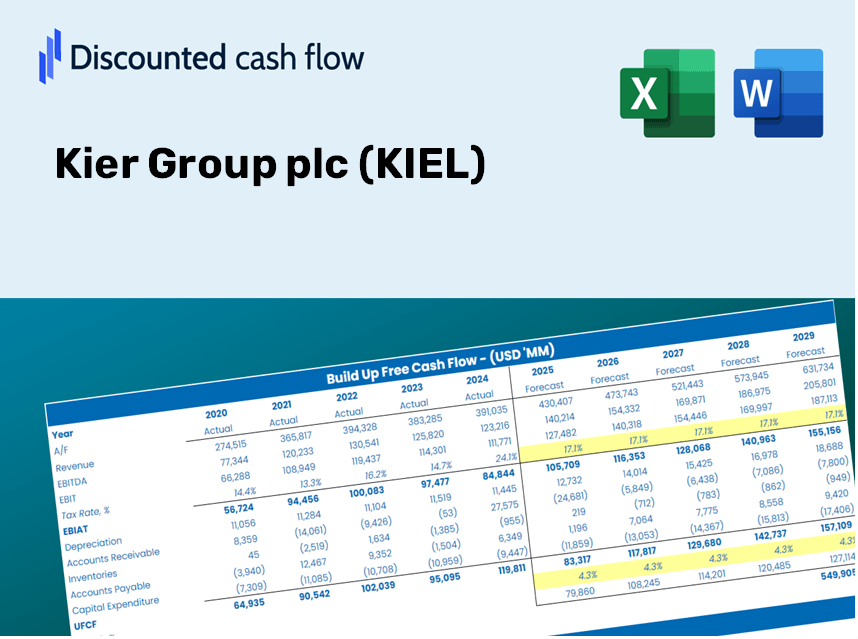
Kier Group plc (KIE.L) Bundle
Simplifique a avaliação do Kier Group PLC com esta calculadora DCF personalizável! Com o Real Kier Group Plc Financials e os insumos de previsão ajustáveis, você pode testar cenários e descobrir o valor justo do Kier Group PLC em minutos.
Discounted Cash Flow (DCF) - (USD MM)
| Year | AY1 2020 |
AY2 2021 |
AY3 2022 |
AY4 2023 |
AY5 2024 |
FY1 2025 |
FY2 2026 |
FY3 2027 |
FY4 2028 |
FY5 2029 |
|---|---|---|---|---|---|---|---|---|---|---|
| Revenue | 3,261.0 | 3,143.9 | 3,380.7 | 3,905.1 | 4,077.1 | 4,320.3 | 4,577.9 | 4,851.0 | 5,140.3 | 5,446.9 |
| Revenue Growth, % | 0 | -3.59 | 7.53 | 15.51 | 4.4 | 5.96 | 5.96 | 5.96 | 5.96 | 5.96 |
| EBITDA | 116.8 | 79.3 | 167.7 | 188.0 | 139.1 | 166.7 | 176.6 | 187.2 | 198.3 | 210.1 |
| EBITDA, % | 3.58 | 2.52 | 4.96 | 4.81 | 3.41 | 3.86 | 3.86 | 3.86 | 3.86 | 3.86 |
| Depreciation | 69.4 | 62.3 | 76.6 | 77.9 | 27.2 | 78.1 | 82.7 | 87.7 | 92.9 | 98.5 |
| Depreciation, % | 2.13 | 1.98 | 2.27 | 1.99 | 0.66714 | 1.81 | 1.81 | 1.81 | 1.81 | 1.81 |
| EBIT | 47.4 | 17.0 | 91.1 | 110.1 | 111.9 | 88.6 | 93.9 | 99.5 | 105.4 | 111.7 |
| EBIT, % | 1.45 | 0.54073 | 2.69 | 2.82 | 2.74 | 2.05 | 2.05 | 2.05 | 2.05 | 2.05 |
| Total Cash | 393.2 | 301.4 | 1,390.5 | 1,570.2 | 1,689.4 | 1,247.9 | 1,322.3 | 1,401.2 | 1,484.7 | 1,573.3 |
| Total Cash, percent | .0 | .0 | .0 | .0 | .0 | .0 | .0 | .0 | .0 | .0 |
| Account Receivables | 509.5 | 549.0 | 463.2 | 512.4 | 519.8 | 627.8 | 665.3 | 704.9 | 747.0 | 791.5 |
| Account Receivables, % | 15.62 | 17.46 | 13.7 | 13.12 | 12.75 | 14.53 | 14.53 | 14.53 | 14.53 | 14.53 |
| Inventories | 54.7 | 56.8 | 72.9 | 74.0 | 65.6 | 79.0 | 83.7 | 88.7 | 94.0 | 99.6 |
| Inventories, % | 1.68 | 1.81 | 2.16 | 1.89 | 1.61 | 1.83 | 1.83 | 1.83 | 1.83 | 1.83 |
| Accounts Payable | 330.3 | 354.2 | 310.0 | 328.4 | 311.0 | 402.7 | 426.7 | 452.1 | 479.1 | 507.7 |
| Accounts Payable, % | 10.13 | 11.27 | 9.17 | 8.41 | 7.63 | 9.32 | 9.32 | 9.32 | 9.32 | 9.32 |
| Capital Expenditure | -9.9 | -16.9 | -8.4 | -18.5 | -11.1 | -15.9 | -16.8 | -17.8 | -18.9 | -20.0 |
| Capital Expenditure, % | -0.30359 | -0.53755 | -0.24847 | -0.47374 | -0.27225 | -0.36712 | -0.36712 | -0.36712 | -0.36712 | -0.36712 |
| Tax Rate, % | 27.78 | 27.78 | 27.78 | 27.78 | 27.78 | 27.78 | 27.78 | 27.78 | 27.78 | 27.78 |
| EBITAT | -2.5 | 13.6 | 72.1 | 69.0 | 80.8 | 52.1 | 55.2 | 58.5 | 62.0 | 65.7 |
| Depreciation | ||||||||||
| Changes in Account Receivables | ||||||||||
| Changes in Inventories | ||||||||||
| Changes in Accounts Payable | ||||||||||
| Capital Expenditure | ||||||||||
| UFCF | -176.9 | 41.3 | 165.8 | 96.5 | 80.5 | 84.6 | 103.0 | 109.1 | 115.6 | 122.5 |
| WACC, % | 2.88 | 4.75 | 4.74 | 4.35 | 4.58 | 4.26 | 4.26 | 4.26 | 4.26 | 4.26 |
| PV UFCF | ||||||||||
| SUM PV UFCF | 469.5 | |||||||||
| Long Term Growth Rate, % | 0.50 | |||||||||
| Free cash flow (T + 1) | 123 | |||||||||
| Terminal Value | 3,275 | |||||||||
| Present Terminal Value | 2,658 | |||||||||
| Enterprise Value | 3,128 | |||||||||
| Net Debt | -53 | |||||||||
| Equity Value | 3,181 | |||||||||
| Diluted Shares Outstanding, MM | 466 | |||||||||
| Equity Value Per Share | 682.43 |
What You Will Receive
- Customizable Excel Template: A fully adjustable Excel-based DCF Calculator featuring pre-filled real KIEL financials.
- Accurate Data: Access to historical data and forward-looking estimates (highlighted in the yellow cells).
- Flexible Forecasting: Modify forecast assumptions such as revenue growth, EBITDA %, and WACC.
- Instant Calculations: Quickly assess how your inputs affect Kier Group's valuation.
- Professional Resource: Designed for investors, CFOs, consultants, and financial analysts.
- Intuitive Layout: Organized for clarity and simplicity, complete with step-by-step instructions.
Key Features
- Comprehensive DCF Calculator: Features detailed unlevered and levered DCF valuation models tailored for Kier Group plc (KIEL).
- WACC Calculator: Equipped with a pre-built Weighted Average Cost of Capital sheet that allows for customizable inputs.
- Customizable Forecast Assumptions: Adjust growth rates, capital expenditures, and discount rates according to your analysis needs.
- Integrated Financial Ratios: Evaluate profitability, leverage, and efficiency ratios specifically for Kier Group plc (KIEL).
- Interactive Dashboard and Visual Charts: Provides visual summaries of key valuation metrics for streamlined analysis.
How It Operates
- Download the Template: Gain immediate access to the Excel-based KIEL DCF Calculator.
- Input Your Assumptions: Modify the yellow-highlighted cells for growth rates, WACC, margins, and more.
- Immediate Calculations: The model automatically recalculates Kier Group’s intrinsic value.
- Test Scenarios: Experiment with various assumptions to assess potential valuation fluctuations.
- Analyze and Decide: Utilize the findings to inform your investment or financial evaluation.
Why Opt for This Calculator?
- All-in-One Solution: Integrates DCF, WACC, and financial ratio assessments seamlessly.
- Flexible Settings: Modify the yellow-highlighted cells to explore various scenarios.
- In-Depth Analysis: Automatically computes Kier Group plc’s intrinsic value and Net Present Value.
- Current Data: Features both historical and projected data for reliable baseline calculations.
- High-Quality Standards: Perfect for financial analysts, investors, and business advisors.
Who Can Benefit from This Product?
- Investors: Assess Kier Group plc’s (KIEL) valuation before making investment decisions.
- CFOs and Financial Analysts: Optimize valuation methodologies and validate financial projections.
- Startup Founders: Gain insights into how established companies like Kier Group plc (KIEL) are valued.
- Consultants: Provide comprehensive valuation reports for your clients based on Kier Group plc (KIEL).
- Students and Educators: Utilize real-life data to enhance learning and teaching of valuation strategies.
Contents of the Template
- Comprehensive DCF Model: An editable template featuring in-depth valuation calculations.
- Real-World Data: Kier Group plc's (KIEL) historical and projected financials already integrated for in-depth analysis.
- Customizable Parameters: Tailor WACC, growth rates, and tax assumptions to explore various scenarios.
- Financial Statements: Complete annual and quarterly reports for enhanced insights.
- Key Ratios: Integrated analysis focusing on profitability, efficiency, and leverage metrics.
- Dashboard with Visual Outputs: Engaging charts and tables to present clear, actionable insights.
Disclaimer
All information, articles, and product details provided on this website are for general informational and educational purposes only. We do not claim any ownership over, nor do we intend to infringe upon, any trademarks, copyrights, logos, brand names, or other intellectual property mentioned or depicted on this site. Such intellectual property remains the property of its respective owners, and any references here are made solely for identification or informational purposes, without implying any affiliation, endorsement, or partnership.
We make no representations or warranties, express or implied, regarding the accuracy, completeness, or suitability of any content or products presented. Nothing on this website should be construed as legal, tax, investment, financial, medical, or other professional advice. In addition, no part of this site—including articles or product references—constitutes a solicitation, recommendation, endorsement, advertisement, or offer to buy or sell any securities, franchises, or other financial instruments, particularly in jurisdictions where such activity would be unlawful.
All content is of a general nature and may not address the specific circumstances of any individual or entity. It is not a substitute for professional advice or services. Any actions you take based on the information provided here are strictly at your own risk. You accept full responsibility for any decisions or outcomes arising from your use of this website and agree to release us from any liability in connection with your use of, or reliance upon, the content or products found herein.