
|
Kinepolis Group NV (KIN.BR) DCF Avaliação |
Totalmente Editável: Adapte-Se Às Suas Necessidades No Excel Ou Planilhas
Design Profissional: Modelos Confiáveis E Padrão Da Indústria
Pré-Construídos Para Uso Rápido E Eficiente
Compatível com MAC/PC, totalmente desbloqueado
Não É Necessária Experiência; Fácil De Seguir
Kinepolis Group NV (KIN.BR) Bundle
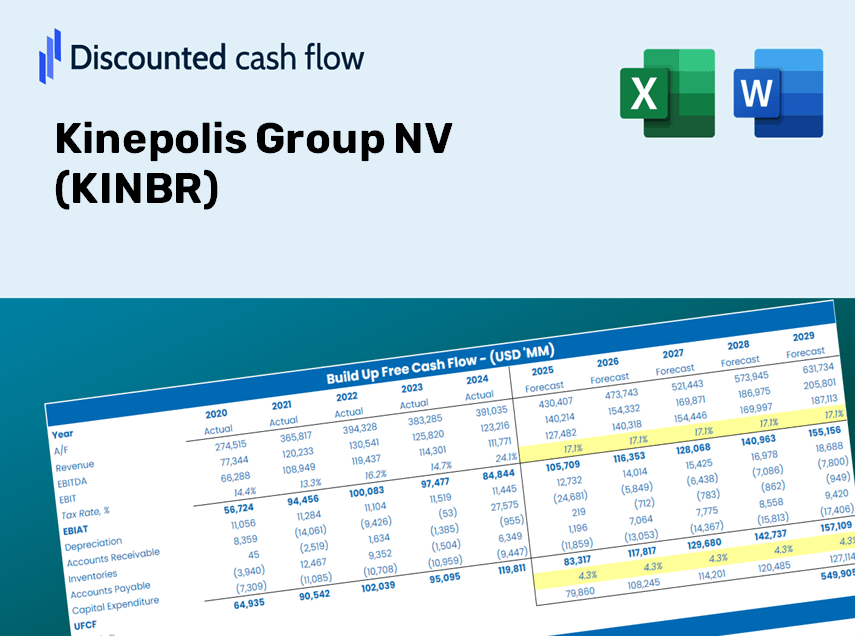
Procurando avaliar o valor intrínseco do grupo Kinepolis NV? Nossa calculadora Kinbr DCF integra dados do mundo real com extensos recursos de personalização, permitindo ajustar as previsões e aprimorar suas opções de investimento.
Discounted Cash Flow (DCF) - (USD MM)
| Year | AY1 2020 |
AY2 2021 |
AY3 2022 |
AY4 2023 |
AY5 2024 |
FY1 2025 |
FY2 2026 |
FY3 2027 |
FY4 2028 |
FY5 2029 |
|---|---|---|---|---|---|---|---|---|---|---|
| Revenue | 176.3 | 266.4 | 499.9 | 605.5 | 578.2 | 802.8 | 1,114.7 | 1,547.7 | 2,148.9 | 2,983.6 |
| Revenue Growth, % | 0 | 51.12 | 87.66 | 21.12 | -4.51 | 38.85 | 38.85 | 38.85 | 38.85 | 38.85 |
| EBITDA | 16.0 | 75.1 | 150.5 | 191.1 | 168.3 | 205.5 | 285.4 | 396.3 | 550.2 | 763.9 |
| EBITDA, % | 9.05 | 28.2 | 30.1 | 31.56 | 29.11 | 25.6 | 25.6 | 25.6 | 25.6 | 25.6 |
| Depreciation | 80.5 | 81.0 | 82.0 | 83.0 | 81.9 | 193.2 | 268.3 | 372.5 | 517.2 | 718.1 |
| Depreciation, % | 45.64 | 30.42 | 16.4 | 13.71 | 14.17 | 24.07 | 24.07 | 24.07 | 24.07 | 24.07 |
| EBIT | -64.5 | -5.9 | 68.5 | 108.1 | 86.4 | 12.3 | 17.1 | 23.8 | 33.0 | 45.9 |
| EBIT, % | -36.59 | -2.22 | 13.71 | 17.85 | 14.94 | 1.54 | 1.54 | 1.54 | 1.54 | 1.54 |
| Total Cash | 33.0 | 75.3 | 67.8 | 101.4 | 84.6 | 147.6 | 204.9 | 284.5 | 395.0 | 548.5 |
| Total Cash, percent | .0 | .0 | .0 | .0 | .0 | .0 | .0 | .0 | .0 | .0 |
| Account Receivables | 21.0 | 30.7 | 42.2 | 46.7 | 49.5 | 77.3 | 107.3 | 149.0 | 206.9 | 287.2 |
| Account Receivables, % | 11.89 | 11.51 | 8.45 | 7.72 | 8.57 | 9.63 | 9.63 | 9.63 | 9.63 | 9.63 |
| Inventories | 3.9 | 5.0 | 7.7 | 7.5 | 8.4 | 13.3 | 18.5 | 25.6 | 35.6 | 49.4 |
| Inventories, % | 2.19 | 1.87 | 1.54 | 1.23 | 1.44 | 1.66 | 1.66 | 1.66 | 1.66 | 1.66 |
| Accounts Payable | 35.8 | 56.6 | 73.4 | 60.5 | 79.2 | 128.4 | 178.3 | 247.5 | 343.7 | 477.2 |
| Accounts Payable, % | 20.33 | 21.26 | 14.68 | 10 | 13.7 | 15.99 | 15.99 | 15.99 | 15.99 | 15.99 |
| Capital Expenditure | -45.2 | -17.1 | -27.8 | -36.1 | -42.6 | -81.8 | -113.6 | -157.7 | -219.0 | -304.0 |
| Capital Expenditure, % | -25.65 | -6.4 | -5.55 | -5.97 | -7.37 | -10.19 | -10.19 | -10.19 | -10.19 | -10.19 |
| Tax Rate, % | 27.01 | 27.01 | 27.01 | 27.01 | 27.01 | 27.01 | 27.01 | 27.01 | 27.01 | 27.01 |
| EBITAT | -48.4 | -4.3 | 50.1 | 80.0 | 63.1 | 9.1 | 12.6 | 17.5 | 24.3 | 33.8 |
| Depreciation | ||||||||||
| Changes in Account Receivables | ||||||||||
| Changes in Inventories | ||||||||||
| Changes in Accounts Payable | ||||||||||
| Capital Expenditure | ||||||||||
| UFCF | -2.2 | 69.7 | 106.8 | 109.7 | 117.3 | 137.0 | 182.0 | 252.7 | 350.8 | 487.1 |
| WACC, % | 6.46 | 6.41 | 6.42 | 6.43 | 6.41 | 6.43 | 6.43 | 6.43 | 6.43 | 6.43 |
| PV UFCF | ||||||||||
| SUM PV UFCF | 1,129.2 | |||||||||
| Long Term Growth Rate, % | 3.30 | |||||||||
| Free cash flow (T + 1) | 503 | |||||||||
| Terminal Value | 16,100 | |||||||||
| Present Terminal Value | 11,792 | |||||||||
| Enterprise Value | 12,921 | |||||||||
| Net Debt | 675 | |||||||||
| Equity Value | 12,247 | |||||||||
| Diluted Shares Outstanding, MM | 27 | |||||||||
| Equity Value Per Share | 450.96 |
What You Will Receive
- Accurate KINBR Financials: Provides historical and projected data for precise valuation.
- Customizable Inputs: Adjust WACC, tax rates, revenue growth, and capital expenditures as needed.
- Automated Calculations: Intrinsic value and NPV are computed in real-time.
- Scenario Analysis: Explore various scenarios to assess Kinepolis Group NV's future performance.
- User-Friendly Interface: Designed for professionals, yet easy to navigate for newcomers.
Key Features
- 🔍 Real-Life KINBR Financials: Pre-filled historical and projected data for Kinepolis Group NV.
- ✏️ Fully Customizable Inputs: Adjust all critical parameters (yellow cells) such as WACC, growth %, and tax rates.
- 📊 Professional DCF Valuation: Built-in formulas calculate Kinepolis’ intrinsic value using the Discounted Cash Flow method.
- ⚡ Instant Results: Visualize Kinepolis’ valuation immediately after making adjustments.
- Scenario Analysis: Test and compare outcomes for various financial assumptions side-by-side.
How It Functions
- Step 1: Download the Excel file.
- Step 2: Examine the pre-filled data for Kinepolis Group NV (KINBR), including historical and forecasted figures.
- Step 3: Modify the key assumptions (highlighted in yellow) according to your insights.
- Step 4: Observe the automatic recalculations reflecting Kinepolis Group NV's (KINBR) intrinsic value.
- Step 5: Utilize the results for your investment evaluations or reporting purposes.
Why Opt for This Calculator?
- Precise Data: Authentic Kinepolis Group NV (KINBR) financials provide trustworthy valuation outcomes.
- Flexible Options: Modify essential factors such as growth rates, WACC, and tax assumptions to fit your forecasts.
- Efficient: Built-in calculations save you the effort of starting from ground zero.
- Professional Quality: Tailored for investors, analysts, and consultants in the industry.
- Easy to Use: User-friendly design and clear instructions ensure accessibility for everyone.
Who Can Benefit from This Product?
- Professional Investors: Create comprehensive and accurate valuation models for investment analysis related to Kinepolis Group NV (KINBR).
- Corporate Finance Teams: Evaluate valuation scenarios to inform strategic decision-making within the organization.
- Consultants and Advisors: Deliver precise valuation insights to clients focusing on Kinepolis Group NV (KINBR) stocks.
- Students and Educators: Leverage real-time data to enhance the practice and teaching of financial modeling techniques.
- Cinema Enthusiasts: Gain insights into how cinema-related companies like Kinepolis Group NV (KINBR) are appraised in the marketplace.
Contents of the Template
- Pre-Filled DCF Model: Kinepolis Group NV’s financial data preloaded for instant access.
- WACC Calculator: Comprehensive calculations for Weighted Average Cost of Capital.
- Financial Ratios: Assess Kinepolis Group NV's profitability, leverage, and efficiency.
- Editable Inputs: Modify assumptions like growth rates, margins, and CAPEX to align with your scenarios.
- Financial Statements: Annual and quarterly reports to facilitate in-depth analysis.
- Interactive Dashboard: Effortlessly visualize essential valuation metrics and outcomes.
Disclaimer
All information, articles, and product details provided on this website are for general informational and educational purposes only. We do not claim any ownership over, nor do we intend to infringe upon, any trademarks, copyrights, logos, brand names, or other intellectual property mentioned or depicted on this site. Such intellectual property remains the property of its respective owners, and any references here are made solely for identification or informational purposes, without implying any affiliation, endorsement, or partnership.
We make no representations or warranties, express or implied, regarding the accuracy, completeness, or suitability of any content or products presented. Nothing on this website should be construed as legal, tax, investment, financial, medical, or other professional advice. In addition, no part of this site—including articles or product references—constitutes a solicitation, recommendation, endorsement, advertisement, or offer to buy or sell any securities, franchises, or other financial instruments, particularly in jurisdictions where such activity would be unlawful.
All content is of a general nature and may not address the specific circumstances of any individual or entity. It is not a substitute for professional advice or services. Any actions you take based on the information provided here are strictly at your own risk. You accept full responsibility for any decisions or outcomes arising from your use of this website and agree to release us from any liability in connection with your use of, or reliance upon, the content or products found herein.