
|
Avaliação DCF da KindCare Learning Companies, Inc. (KLC) |
Totalmente Editável: Adapte-Se Às Suas Necessidades No Excel Ou Planilhas
Design Profissional: Modelos Confiáveis E Padrão Da Indústria
Pré-Construídos Para Uso Rápido E Eficiente
Compatível com MAC/PC, totalmente desbloqueado
Não É Necessária Experiência; Fácil De Seguir
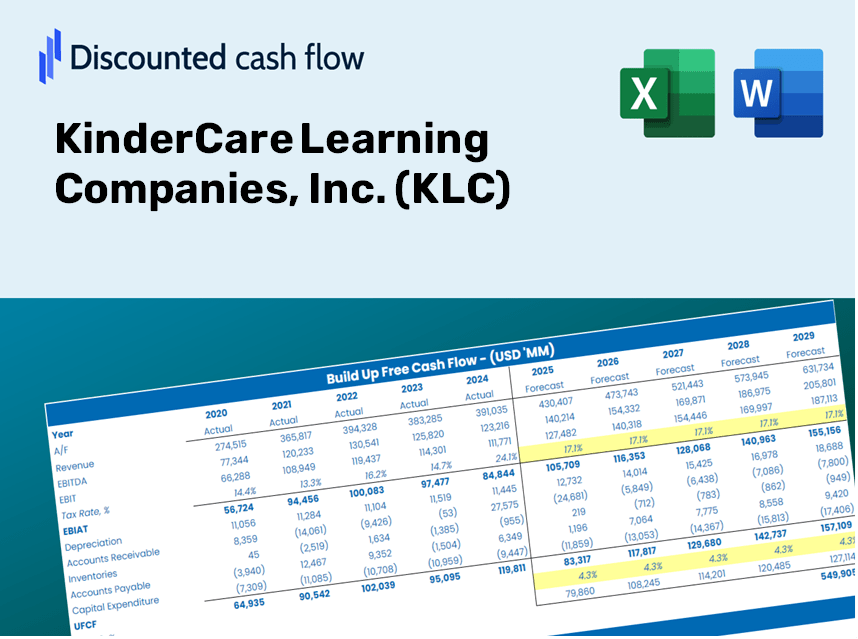
KinderCare Learning Companies, Inc. (KLC) Bundle
Aprimore suas estratégias de investimento com a calculadora DCF (KLC)! Utilize dados financeiros autênticos da KinderCare, ajuste as projeções e despesas de crescimento e observe instantaneamente como essas modificações afetam o valor intrínseco de (KLC).
Your Benefits
- Pre-Filled Financial Model: Utilize KinderCare’s actual data for accurate DCF valuation.
- Comprehensive Forecast Control: Modify key metrics such as revenue growth, margins, WACC, and more.
- Real-Time Calculations: Automatic updates allow you to view results instantly as you adjust inputs.
- Professional-Grade Template: A polished Excel file crafted for high-quality valuation.
- Flexible and Reusable: Designed for adaptability, permitting repeated use for in-depth forecasts.
Key Features
- Comprehensive KinderCare Financials: Gain access to reliable historical data and forward-looking forecasts tailored for KLC (KLC).
- Customizable Forecast Inputs: Modify the highlighted fields for WACC, growth rates, and profit margins to fit your analysis.
- Automated Calculations: Enjoy real-time updates for DCF, Net Present Value (NPV), and cash flow assessments.
- Interactive Dashboard: Utilize clear charts and summaries to effectively present your valuation findings.
- Designed for All Users: An intuitive layout suitable for investors, CFOs, and consultants alike.
How It Works
- Step 1: Download the prebuilt Excel template featuring KinderCare Learning Companies, Inc.'s (KLC) data.
- Step 2: Review the pre-filled sheets to familiarize yourself with the essential metrics.
- Step 3: Modify forecasts and assumptions in the editable yellow cells (WACC, growth, margins).
- Step 4: Instantly view the updated results, including KinderCare’s intrinsic value.
- Step 5: Make well-informed investment choices or create reports based on the outputs.
Why Choose This Calculator for KinderCare Learning Companies, Inc. (KLC)?
- Designed for Experts: A sophisticated tool utilized by educators, executives, and financial analysts.
- Comprehensive Data: KinderCare’s historical and projected financials preloaded for precision and reliability.
- Scenario Analysis: Effortlessly model various forecasts and assumptions.
- Intuitive Outputs: Automatically computes key metrics, intrinsic value, and NPV.
- User-Friendly: Step-by-step guidance makes the process straightforward.
Who Can Benefit from KinderCare Learning Companies, Inc. (KLC)?
- Parents: Access high-quality early childhood education resources for your children.
- Educators: Enhance your teaching methods with proven curriculum and training materials.
- Childcare Professionals: Utilize our programs to improve your skills and provide exceptional care.
- Investors: Gain insights into the education sector and make informed investment choices.
- Researchers and Policy Makers: Use our data and insights to inform studies and educational policies.
What the Template Includes
- Historical Data: Features KinderCare Learning Companies, Inc. (KLC)'s past financials and foundational forecasts.
- DCF and Levered DCF Models: Comprehensive templates for calculating KinderCare's intrinsic value.
- WACC Sheet: Preconfigured calculations for Weighted Average Cost of Capital.
- Editable Inputs: Adjust key variables such as growth rates, EBITDA %, and CAPEX assumptions.
- Quarterly and Annual Statements: A thorough analysis of KinderCare's financial performance.
- Interactive Dashboard: Dynamically visualize valuation outcomes and future projections.
Disclaimer
All information, articles, and product details provided on this website are for general informational and educational purposes only. We do not claim any ownership over, nor do we intend to infringe upon, any trademarks, copyrights, logos, brand names, or other intellectual property mentioned or depicted on this site. Such intellectual property remains the property of its respective owners, and any references here are made solely for identification or informational purposes, without implying any affiliation, endorsement, or partnership.
We make no representations or warranties, express or implied, regarding the accuracy, completeness, or suitability of any content or products presented. Nothing on this website should be construed as legal, tax, investment, financial, medical, or other professional advice. In addition, no part of this site—including articles or product references—constitutes a solicitation, recommendation, endorsement, advertisement, or offer to buy or sell any securities, franchises, or other financial instruments, particularly in jurisdictions where such activity would be unlawful.
All content is of a general nature and may not address the specific circumstances of any individual or entity. It is not a substitute for professional advice or services. Any actions you take based on the information provided here are strictly at your own risk. You accept full responsibility for any decisions or outcomes arising from your use of this website and agree to release us from any liability in connection with your use of, or reliance upon, the content or products found herein.