
|
Avaliação DCF de Transportation Holdings Inc. (KNX) da Knigh-Swift (KNX) |
Totalmente Editável: Adapte-Se Às Suas Necessidades No Excel Ou Planilhas
Design Profissional: Modelos Confiáveis E Padrão Da Indústria
Pré-Construídos Para Uso Rápido E Eficiente
Compatível com MAC/PC, totalmente desbloqueado
Não É Necessária Experiência; Fácil De Seguir
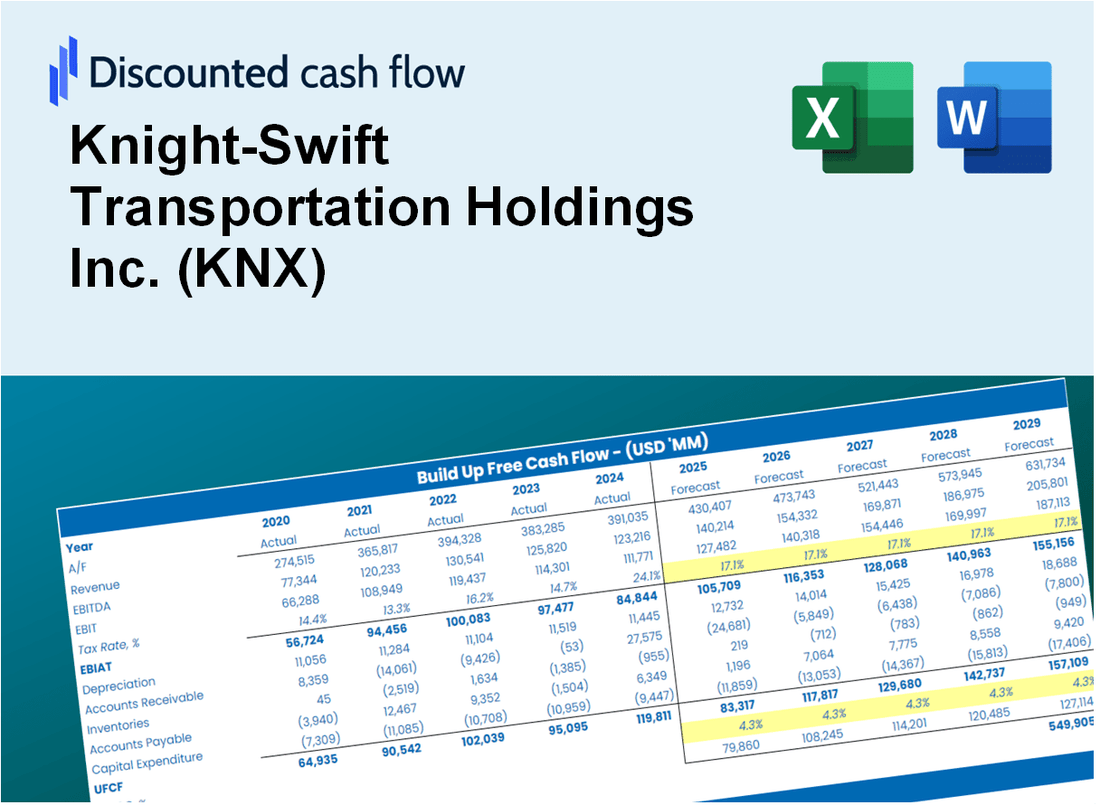
Knight-Swift Transportation Holdings Inc. (KNX) Bundle
Avalie as perspectivas financeiras da Knxight-Swift Transportation Holdings Inc. (KNX) como um especialista! Esta calculadora DCF (KNX) fornece dados financeiros pré-preenchidos e flexibilidade total para modificar o crescimento da receita, o WACC, as margens e outras suposições essenciais para se alinhar às suas projeções.
Discounted Cash Flow (DCF) - (USD MM)
| Year | AY1 2020 |
AY2 2021 |
AY3 2022 |
AY4 2023 |
AY5 2024 |
FY1 2025 |
FY2 2026 |
FY3 2027 |
FY4 2028 |
FY5 2029 |
|---|---|---|---|---|---|---|---|---|---|---|
| Revenue | 4,673.9 | 5,998.0 | 7,428.6 | 7,141.8 | 7,410.1 | 8,374.8 | 9,465.2 | 10,697.5 | 12,090.2 | 13,664.3 |
| Revenue Growth, % | 0 | 28.33 | 23.85 | -3.86 | 3.76 | 13.02 | 13.02 | 13.02 | 13.02 | 13.02 |
| EBITDA | 1,073.4 | 1,469.1 | 1,659.6 | 1,012.6 | 1,027.1 | 1,638.8 | 1,852.1 | 2,093.3 | 2,365.8 | 2,673.8 |
| EBITDA, % | 22.97 | 24.49 | 22.34 | 14.18 | 13.86 | 19.57 | 19.57 | 19.57 | 19.57 | 19.57 |
| Depreciation | 506.7 | 577.9 | 659.8 | 735.1 | 792.8 | 843.3 | 953.1 | 1,077.2 | 1,217.5 | 1,376.0 |
| Depreciation, % | 10.84 | 9.63 | 8.88 | 10.29 | 10.7 | 10.07 | 10.07 | 10.07 | 10.07 | 10.07 |
| EBIT | 566.8 | 891.2 | 999.7 | 277.5 | 234.3 | 795.5 | 899.0 | 1,016.1 | 1,148.3 | 1,297.9 |
| EBIT, % | 12.13 | 14.86 | 13.46 | 3.89 | 3.16 | 9.5 | 9.5 | 9.5 | 9.5 | 9.5 |
| Total Cash | 205.0 | 354.1 | 389.7 | 466.4 | 365.9 | 452.3 | 511.2 | 577.8 | 653.0 | 738.0 |
| Total Cash, percent | .0 | .0 | .0 | .0 | .0 | .0 | .0 | .0 | .0 | .0 |
| Account Receivables | 598.8 | 937.0 | 925.2 | 966.7 | 848.2 | 1,103.3 | 1,247.0 | 1,409.3 | 1,592.8 | 1,800.2 |
| Account Receivables, % | 12.81 | 15.62 | 12.46 | 13.54 | 11.45 | 13.17 | 13.17 | 13.17 | 13.17 | 13.17 |
| Inventories | .0 | .0 | .0 | .0 | .0 | .0 | .0 | .0 | .0 | .0 |
| Inventories, % | 0 | 0 | 0 | 0 | 0 | 0 | 0 | 0 | 0 | 0 |
| Accounts Payable | 101.0 | 224.8 | 220.8 | 355.2 | 329.7 | 306.6 | 346.5 | 391.6 | 442.6 | 500.3 |
| Accounts Payable, % | 2.16 | 3.75 | 2.97 | 4.97 | 4.45 | 3.66 | 3.66 | 3.66 | 3.66 | 3.66 |
| Capital Expenditure | -521.1 | -534.1 | -800.6 | -1,071.6 | -819.2 | -952.9 | -1,076.9 | -1,217.1 | -1,375.6 | -1,554.7 |
| Capital Expenditure, % | -11.15 | -8.9 | -10.78 | -15 | -11.05 | -11.38 | -11.38 | -11.38 | -11.38 | -11.38 |
| Tax Rate, % | 21.08 | 21.08 | 21.08 | 21.08 | 21.08 | 21.08 | 21.08 | 21.08 | 21.08 | 21.08 |
| EBITAT | 414.7 | 679.7 | 755.6 | 223.0 | 184.9 | 611.4 | 691.0 | 780.9 | 882.6 | 997.5 |
| Depreciation | ||||||||||
| Changes in Account Receivables | ||||||||||
| Changes in Inventories | ||||||||||
| Changes in Accounts Payable | ||||||||||
| Capital Expenditure | ||||||||||
| UFCF | -97.5 | 509.1 | 622.7 | -20.6 | 251.6 | 223.6 | 463.4 | 523.8 | 592.0 | 669.0 |
| WACC, % | 7.88 | 7.94 | 7.93 | 8.01 | 7.99 | 7.95 | 7.95 | 7.95 | 7.95 | 7.95 |
| PV UFCF | ||||||||||
| SUM PV UFCF | 1,913.5 | |||||||||
| Long Term Growth Rate, % | 3.00 | |||||||||
| Free cash flow (T + 1) | 689 | |||||||||
| Terminal Value | 13,923 | |||||||||
| Present Terminal Value | 9,498 | |||||||||
| Enterprise Value | 11,412 | |||||||||
| Net Debt | 2,452 | |||||||||
| Equity Value | 8,959 | |||||||||
| Diluted Shares Outstanding, MM | 162 | |||||||||
| Equity Value Per Share | 55.25 |
What You Will Get
- Pre-Filled Financial Model: Knight-Swift's actual data facilitates accurate DCF valuation.
- Full Forecast Control: Modify revenue growth, margins, WACC, and other essential drivers.
- Instant Calculations: Real-time updates ensure you see results immediately as you make adjustments.
- Investor-Ready Template: A polished Excel file crafted for high-quality valuation.
- Customizable and Reusable: Designed for flexibility, allowing for repeated use in comprehensive forecasts.
Key Features
- Comprehensive KNX Data: Pre-filled with Knight-Swift's historical performance metrics and future growth forecasts.
- Customizable Assumptions: Tailor inputs for revenue growth, operating margins, WACC, tax rates, and capital expenditures.
- Interactive Valuation Framework: Automatic recalculations of Net Present Value (NPV) and intrinsic value based on your customized inputs.
- Scenario Analysis: Develop various forecasting scenarios to evaluate different valuation possibilities.
- Intuitive Interface: Designed for ease of use, catering to both seasoned professionals and newcomers.
How It Works
- 1. Access the Template: Download and open the Excel file containing Knight-Swift Transportation Holdings Inc.'s preloaded data.
- 2. Modify Assumptions: Adjust essential inputs such as growth rates, WACC, and capital expenditures specific to (KNX).
- 3. View Results in Real-Time: The DCF model automatically calculates intrinsic value and NPV based on your inputs.
- 4. Explore Scenarios: Analyze various forecasts to evaluate different valuation results for (KNX).
- 5. Present with Assurance: Deliver professional valuation insights to enhance your decision-making process for (KNX).
Why Choose Knight-Swift Transportation Holdings Inc. (KNX)?
- Streamlined Operations: Benefit from an established logistics network that enhances efficiency.
- Data-Driven Decisions: Access to reliable analytics and insights for informed strategic planning.
- Flexible Solutions: Customize services to meet your specific transportation needs and goals.
- User-Friendly Interface: Intuitive tools and resources simplify the management of your logistics.
- Industry Expertise: Rely on a team of professionals dedicated to delivering top-notch transportation services.
Who Should Use This Product?
- Individual Investors: Make informed decisions about buying or selling Knight-Swift Transportation Holdings Inc. (KNX) stock.
- Financial Analysts: Streamline valuation processes with ready-to-use financial models specific to Knight-Swift Transportation Holdings Inc. (KNX).
- Consultants: Deliver professional valuation insights on Knight-Swift Transportation Holdings Inc. (KNX) to clients quickly and accurately.
- Business Owners: Understand how large transportation companies like Knight-Swift Transportation Holdings Inc. (KNX) are valued to guide your own strategy.
- Finance Students: Learn valuation techniques using real-world data and scenarios related to Knight-Swift Transportation Holdings Inc. (KNX).
What the Template Contains
- Pre-Filled DCF Model: Knight-Swift’s financial data preloaded for immediate use.
- WACC Calculator: Detailed calculations for Weighted Average Cost of Capital.
- Financial Ratios: Evaluate Knight-Swift’s profitability, leverage, and efficiency.
- Editable Inputs: Change assumptions such as growth, margins, and CAPEX to fit your scenarios.
- Financial Statements: Annual and quarterly reports to support detailed analysis.
- Interactive Dashboard: Easily visualize key valuation metrics and results.
Disclaimer
All information, articles, and product details provided on this website are for general informational and educational purposes only. We do not claim any ownership over, nor do we intend to infringe upon, any trademarks, copyrights, logos, brand names, or other intellectual property mentioned or depicted on this site. Such intellectual property remains the property of its respective owners, and any references here are made solely for identification or informational purposes, without implying any affiliation, endorsement, or partnership.
We make no representations or warranties, express or implied, regarding the accuracy, completeness, or suitability of any content or products presented. Nothing on this website should be construed as legal, tax, investment, financial, medical, or other professional advice. In addition, no part of this site—including articles or product references—constitutes a solicitation, recommendation, endorsement, advertisement, or offer to buy or sell any securities, franchises, or other financial instruments, particularly in jurisdictions where such activity would be unlawful.
All content is of a general nature and may not address the specific circumstances of any individual or entity. It is not a substitute for professional advice or services. Any actions you take based on the information provided here are strictly at your own risk. You accept full responsibility for any decisions or outcomes arising from your use of this website and agree to release us from any liability in connection with your use of, or reliance upon, the content or products found herein.